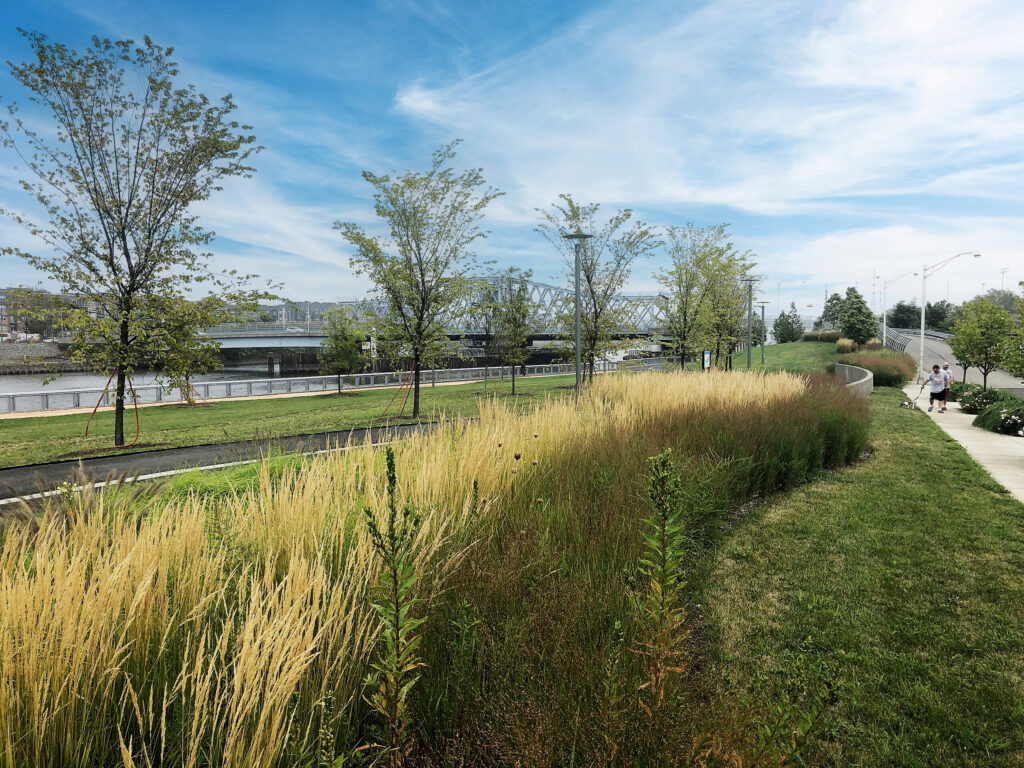
Image Credit: East River Park, 2025. Bjarke Ingels Group
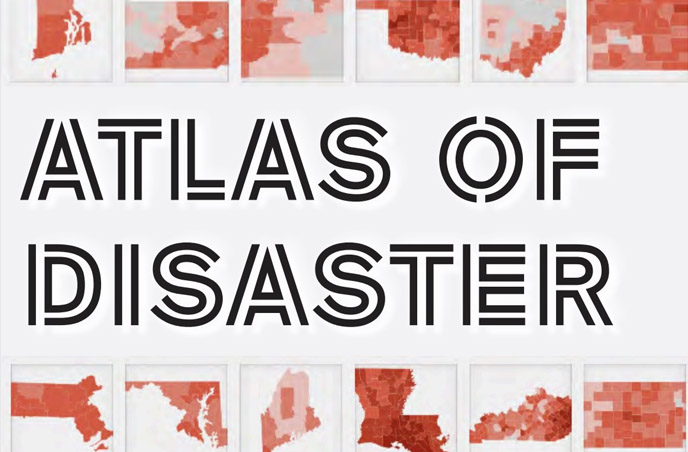
ATLAS OF DISASTER & ACCOUNTABILITY (2011-2024)
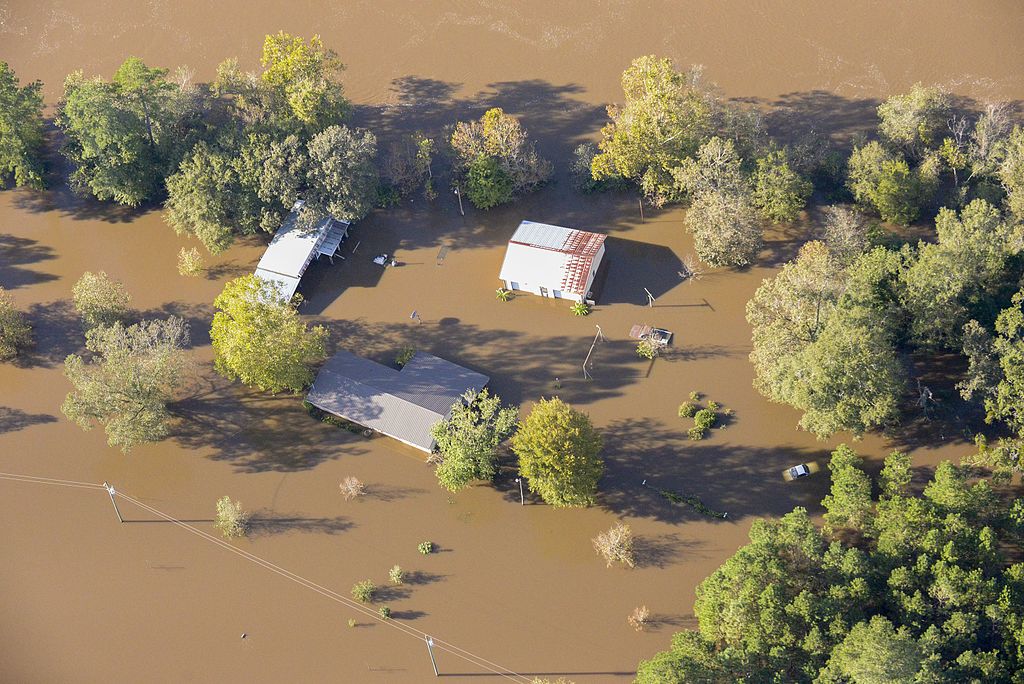
Between 2011 and 2024, 99.5% of congressional districts experienced at least one federally declared major disaster due to extreme weather, affecting communities across political, urban-rural, and socioeconomic lines. These events, fueled by climate change, cost taxpayers $117.9 billion in federal relief—$72.7 billion from FEMA for hazard mitigation (HM) and public assistance (PA), as well as $45.2 billion from HUD’s Community Development Block Grant – Disaster Recovery (CDBG-DR) program.
The Atlas of Accountability maps federal disaster declarations and post-disaster assistance obligations for every county in the U.S., with overlays by congressional district. It reveals where billions in taxpayer dollars have been spent and raises a critical question: How can we invest in long-term resilience, instead of paying for recovery again and again?
You will find below a county-by-county look across the United States. From Alabama to Wyoming, you can visualize how disaster occurrences, federal funding, and community vulnerability intersect. Whether you are a policymaker, journalist, planner, or concerned resident, the Atlas helps you:
Understand your state’s data through the Atlas of Accountability interactive tool.
Use the Atlas report to advocate for smarter, forward-looking investments.
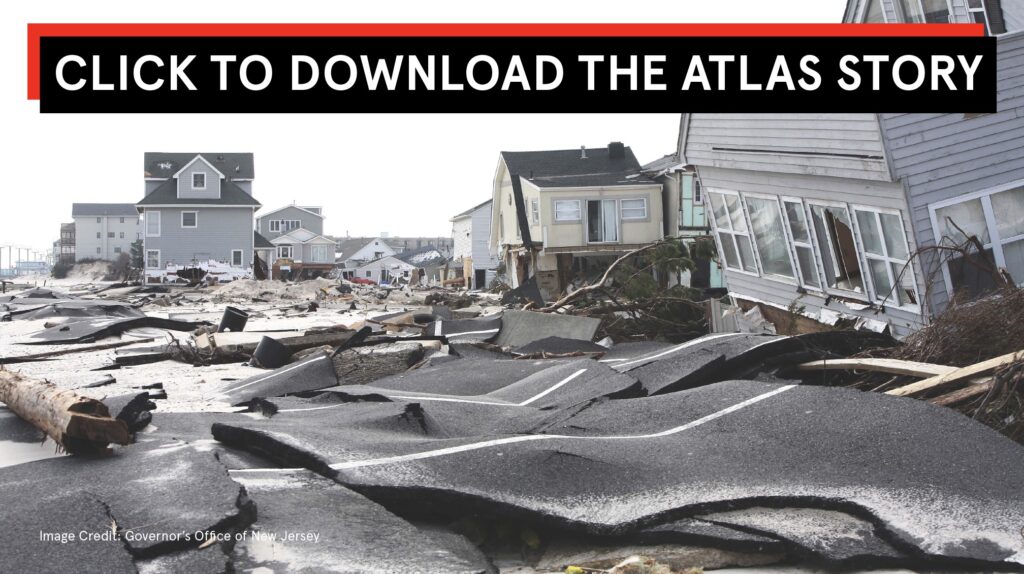
Released in 2022, the Atlas of Disaster offers a county-by-county snapshot of climate-driven disasters across the U.S. from 2011–2021. The report highlights widespread impacts, gaps in federal policy, and the urgent need for pre-disaster investment in both physical and social infrastructure. Read the report >>
SHARE YOUR STATE & YOUR STORY
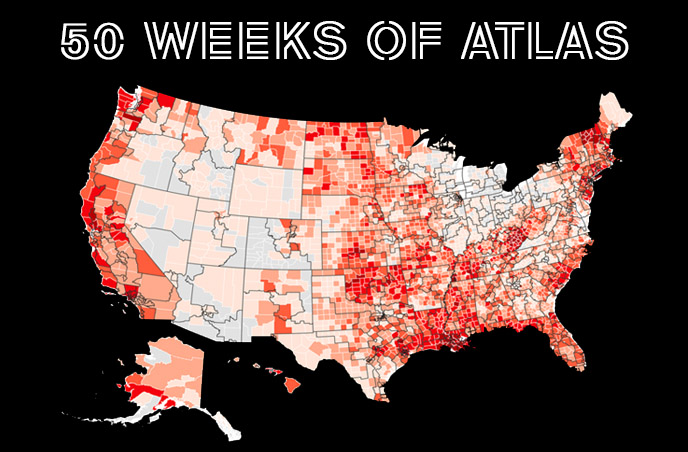
Each week in 2025, we shared a key finding from the Atlas for all 50 states through downloadable graphics and captions. Explore your state’s climate risk data and help spread awareness by sharing it on social media. Download state >>
CLIMATE INFRASTRUCTURE WE LOVE
Explore a growing collection of climate infrastructure projects, planning strategies, & funding approaches That are currently helping communities across the U.S. build resilience. Get inspired >>
Between 2011 and 2024, 40 states—representing 80% of the U.S.—recorded ten or more major disaster declarations. In 28 of those states, every county experienced at least one disaster.
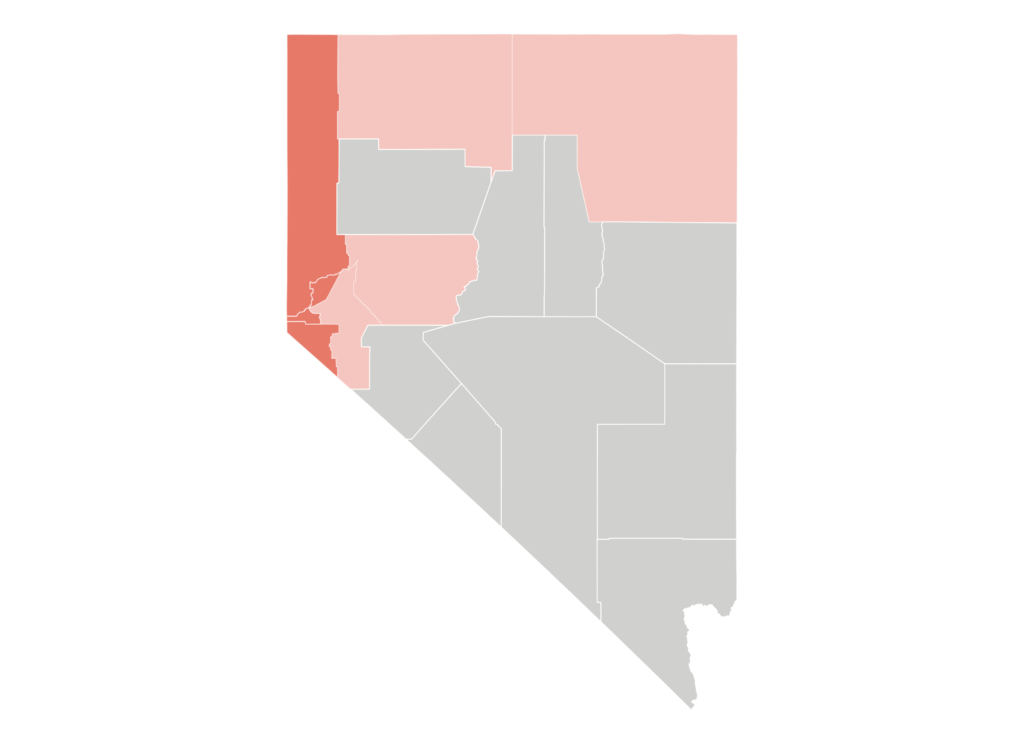
39 DISASTERS IN CALIFORNIA*
California* experienced 39 major federal disaster declarations—more than any other state. Some declarations may be counted separately for tribal lands.
95.5% of U.S. Residents Live in Disaster-Declared Counties
Since 2011, around 315.6 million Americans reside in counties that have experienced a major disaster declaration, representing 95.5% of the U.S. population.
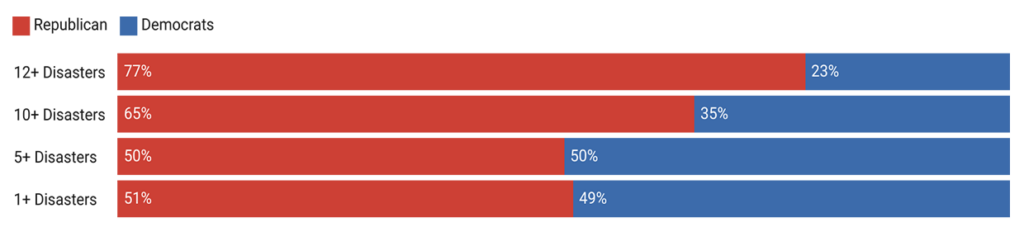
99.5% OF CONGRESSIONAL DISTRICTS HAVE EXPERIENCED DISASTERS
Only two districts have reported zero major disaster declarations since 2011, underscoring the bipartisan need for resilient infrastructure.
$117.9 BILLION IN FEDERAL DISASTER FUNDS
Since 2011, the federal government has allocated $72.7 billion through FEMA’s Public Assistance and Hazard Mitigation programs, plus $45.2 billion in HUD CDBG-DR funds for extreme weather events.
$1 INVESTED IN PRE-STORM ADAPTATION CAN SAVE $11
According to the National Association of Building Sciences, investing in pre-storm adaptation has a 11:1 payback for building code enhancements, 7:1 for riverine flooding, and 13:1 for earthquakes. Investing saves taxpayer dollars.
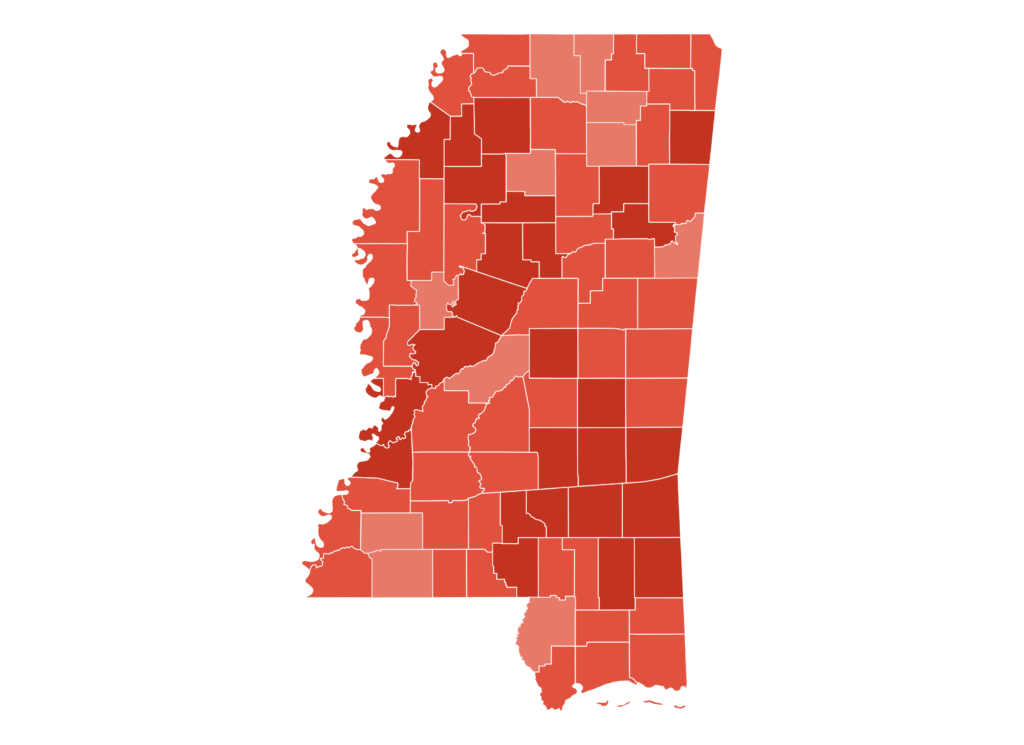
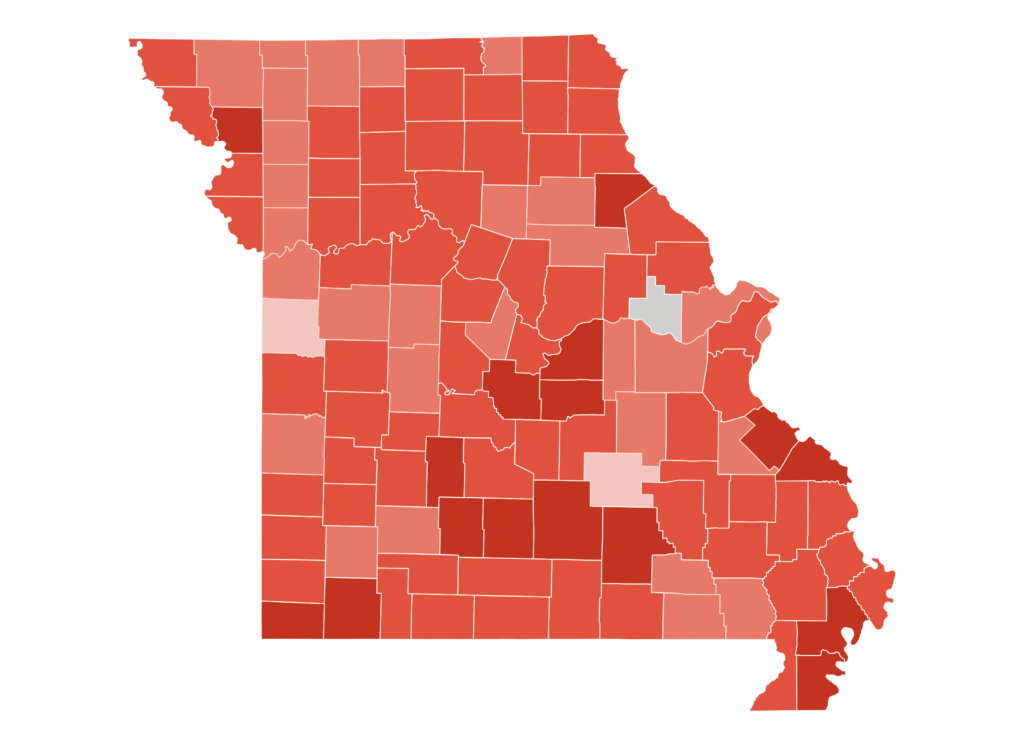
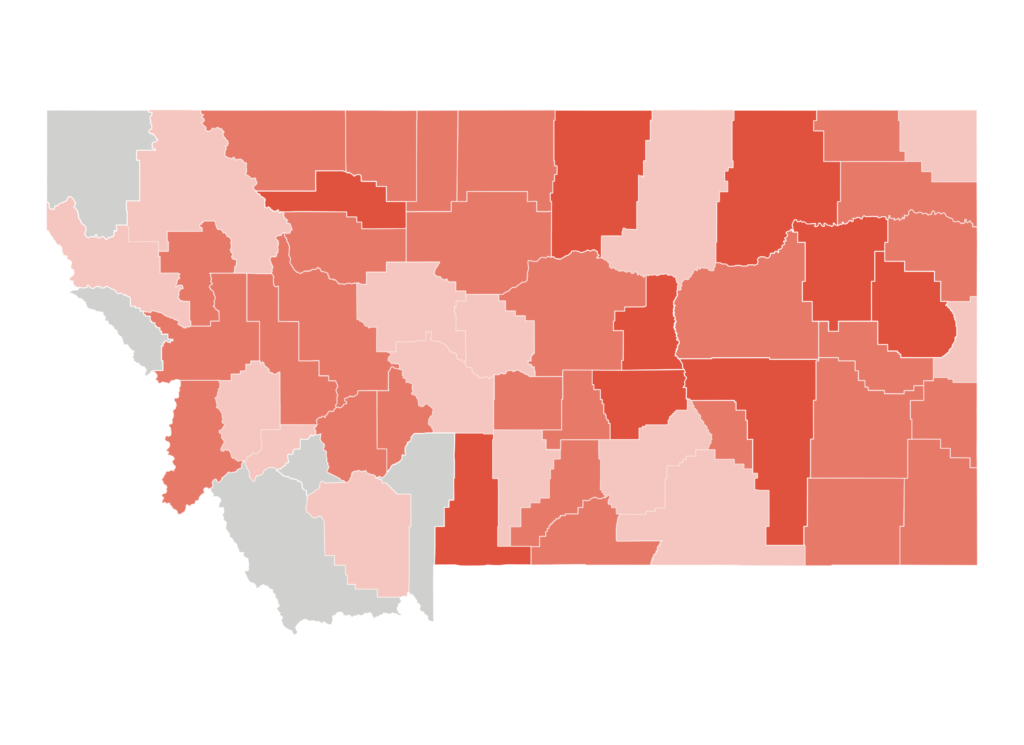
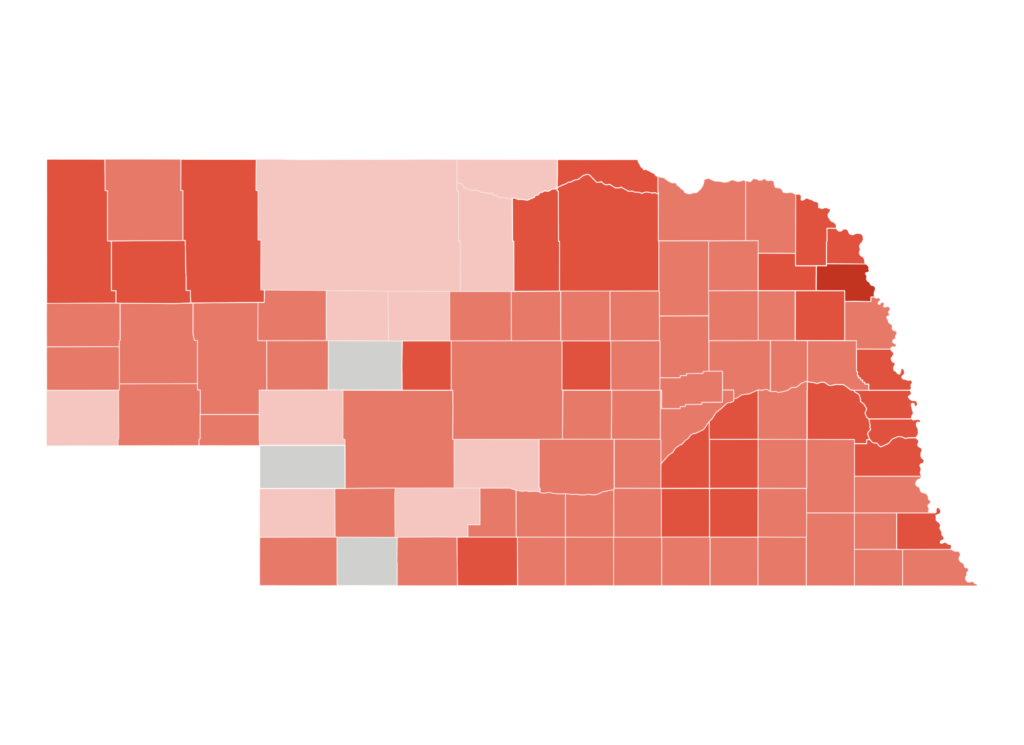
Disaster Count Across All Congressional Districts 2011-2024
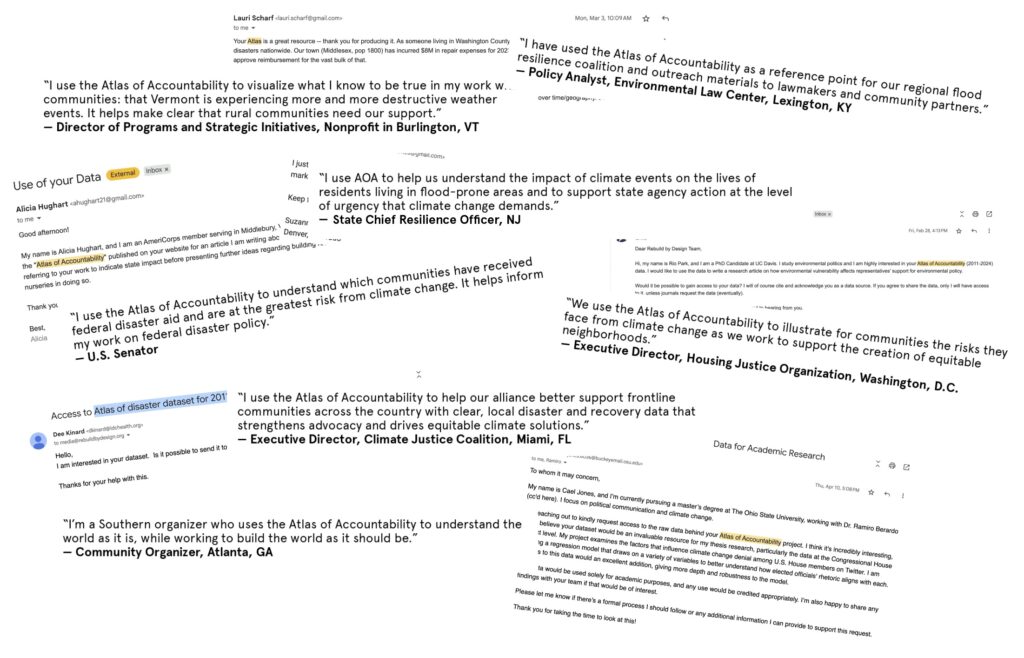
TELL US HOW YOU ARE USING THE ATLAS
SEARCH YOUR STATE's DISASTER DECLARATIONS & FEDERAL ASSISTANCE
As Connecticut confronts increasing disasters and mounting infrastructure needs, Rebuild by Design is equipping communities and policymakers with data, tools, and a statewide legislative lookup to strengthen advocacy for long-term investment in climate resilience. Learn more>>
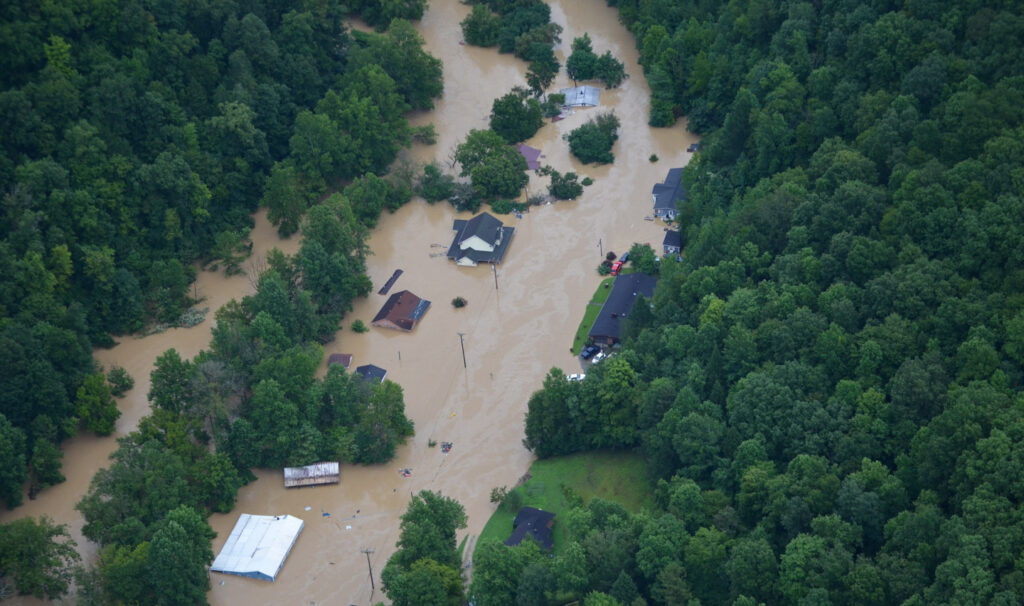
KENTUCKY
Counties in Kentucky continue to top the charts for the most disaster occurrences in the nation. Rebuild is seeding a coalition of NGO to raise awareness of the State’s risk and work together to develop long term solutions. Learn more>>
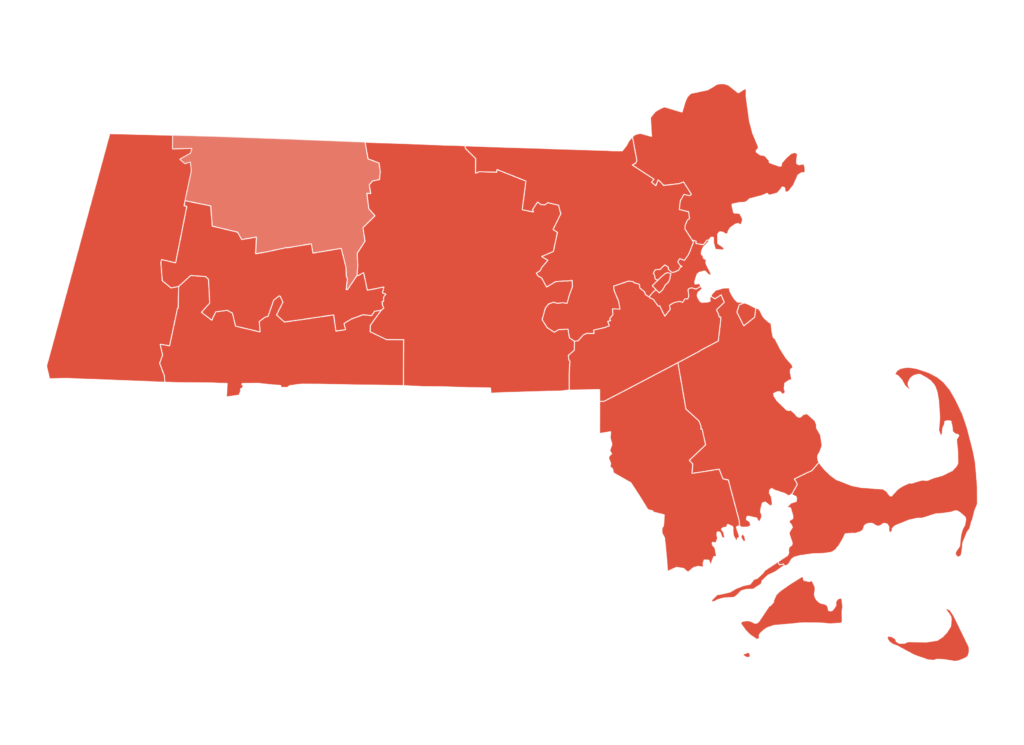
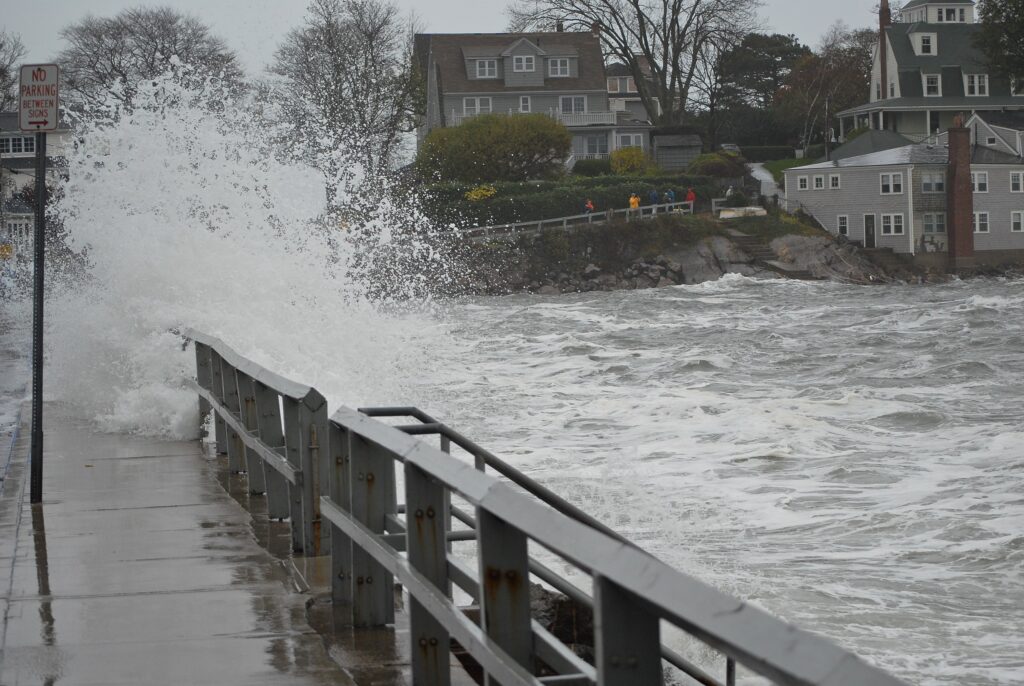
MASSACHUSETTS
Massachusetts communities face escalating climate risks that threaten lives, infrastructure, and public health. Rebuild by Design is working with local partners to call for dedicated, long-term funding to support community-led, data-informed climate adaptation Learn more>>
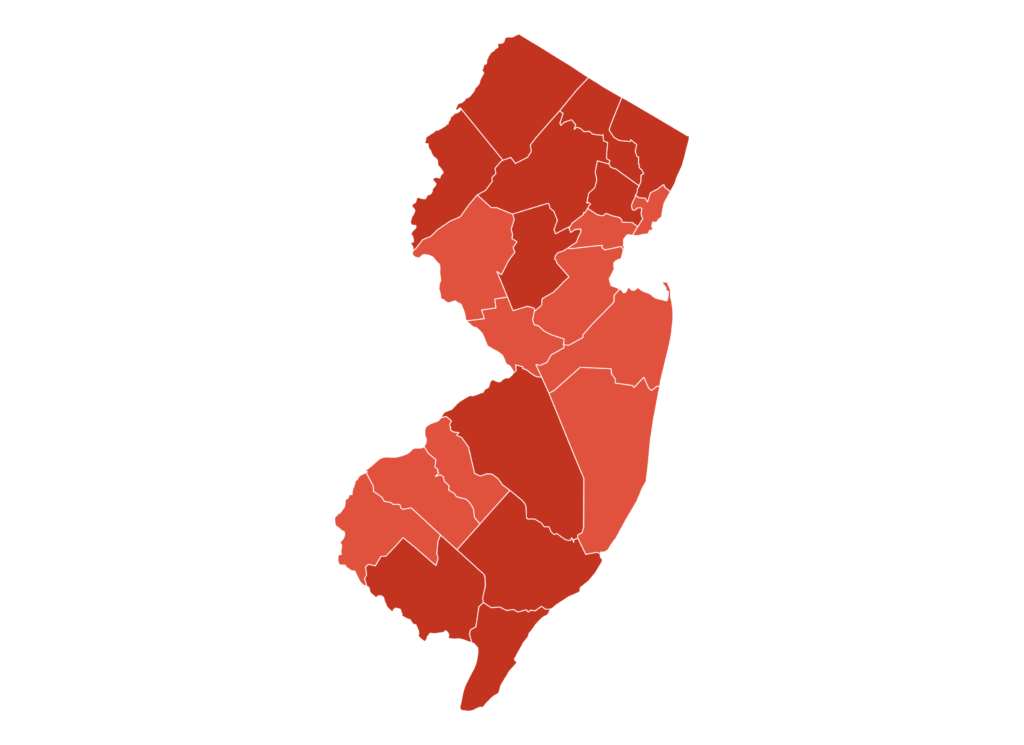
NEW JERSEY
From coastal and river flooding to intense storms and power‑outage events, communities across New Jersey face mounting climate risks. Rebuild by Design is partnering with local organizations and leaders to build a movement aimed at securing sustainable, dedicated funding for climate resilience and long‑term adaptation. Learn more>>
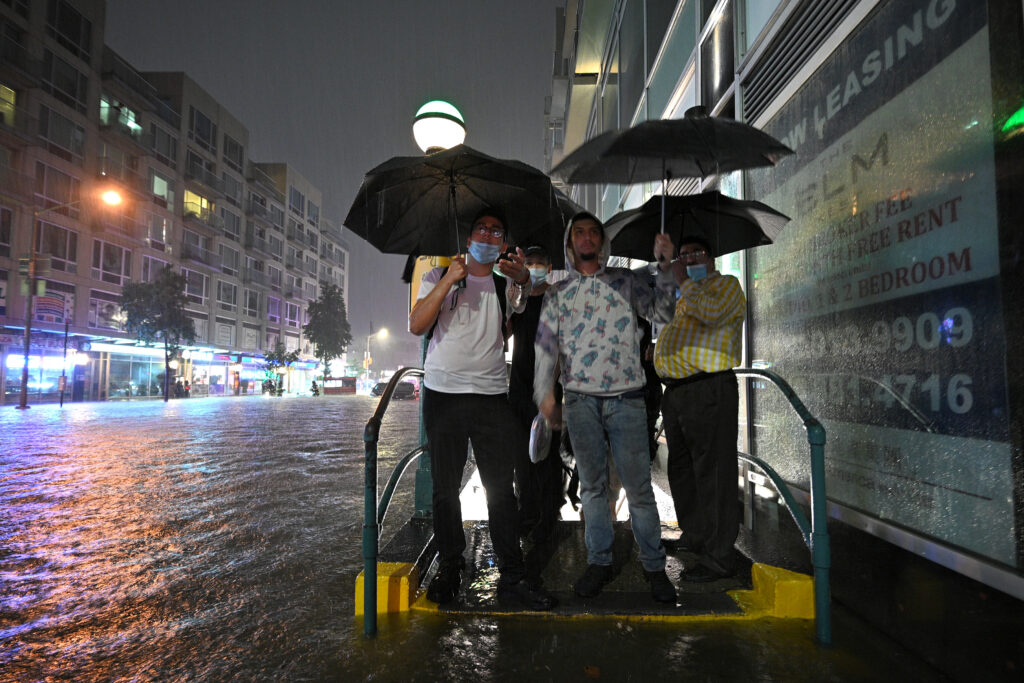
NEW YORK
By leading the coalition behind the landmark $4.2 billion Environmental Bond Act, Rebuild set a model for how states can fund resilient infrastructure, create jobs, and prepare communities for future climate risks. Learn more>>
NORTH CAROLINA
North Carolina’s future depends on proactive planning and bold investment today. Hurricane Helene alone caused an estimated $59.6 billion in damages in the state, making it one of the costliest hurricanes in U.S. history. Learn more>>
VERMONT
Through partnerships with local legislators and organizations, Rebuild co-hosted an educational series to equip current and incoming lawmakers with the tools to build local capacity for adapting to extreme weather. Learn more>>
WEST VIRGINIA
Extreme weather is no longer an occasional disruption for West Virginia—it is a recurring and costly challenge that affects communities statewide. Rebuild collaborates with local organizations to equip current and incoming lawmakers with the tools to build local capacity for adapting to extreme weather. Learn more>>
TOGETHER, WE CAN FIX THIS
While these numbers seem bleak, there are actions we can take to protect communities lives and livelihoods. Rebuild by Design is calling for:
1. Shifting post-disaster federal dollars for pre-disaster funding so communities can invest in infrastructure before they suffer.
2. Creating new sources of dedicated funding such as investigating state voter referendums, surcharges on certain types of insurance coverage (e.g., property and casualty), and state-level superfund laws.
3. Mandating that U.S. insurance companies take into account mitigation measures when pricing insurance policies. Insurance companies already increase prices with increasing risk. Conversely, companies should reduce premiums when risk-reduction measures are implemented, giving policyholders incentives to take actions that will save all taxpayers money. Just as FEMA does with the National Flood Insurance Program’s Community Rating System.
4. Building better infrastructure. Ensure that every piece of new infrastructure is built to withstand climate events to the life cycle of that infrastructure. Design infrastructure to address both physical and social vulnerabilities, thus multiplying taxpayers’ investments.
5. Amending the Stafford Act to better account for loss of life – not just cost of damages – so that communities experiencing extreme heat and cold events are able to access federal recovery resources.
Atlas of Accountability is based on research and data sources provided by the following:
Spatial Analysis: Congressional districts were assigned to counties using spatial analysis, with a minimum 5% area overlap threshold between county and district boundaries.
Note: Extreme heat is recognized as a leading threat in what is on track to be the hottest year on record (Climate Central). It is not included in this analysis because the Stafford Act, the law governing the disaster declaration process, ties disaster declarations to economic loss or damages. Since extreme heat events are less likely to cause physical damage, there has never been a federal major disaster declaration for extreme heat or extended heat waves. According to NOAA, heat remains the leading cause of weather-related deaths in the United States.
Terms: “Major Disaster Declaration” as issued by the President for severe events beyond Local or State control, “Climate Disaster” as extreme weather events worsened by climate change (excluding e.g. biological), “FEMA Public Assistance” as funding for local, state, or tribal governments for disaster response and recovery, and “FEMA Hazard Mitigation” as funding for local, state, or tribal governments to reduce future disaster risks tied to the same climate event.
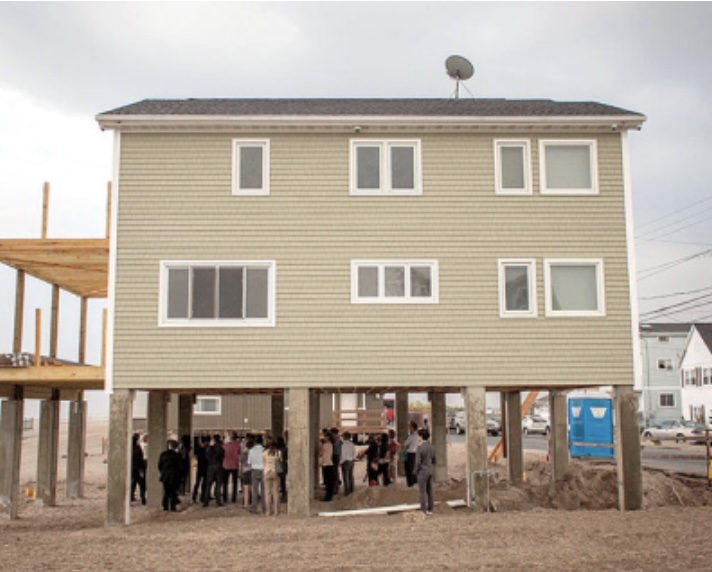
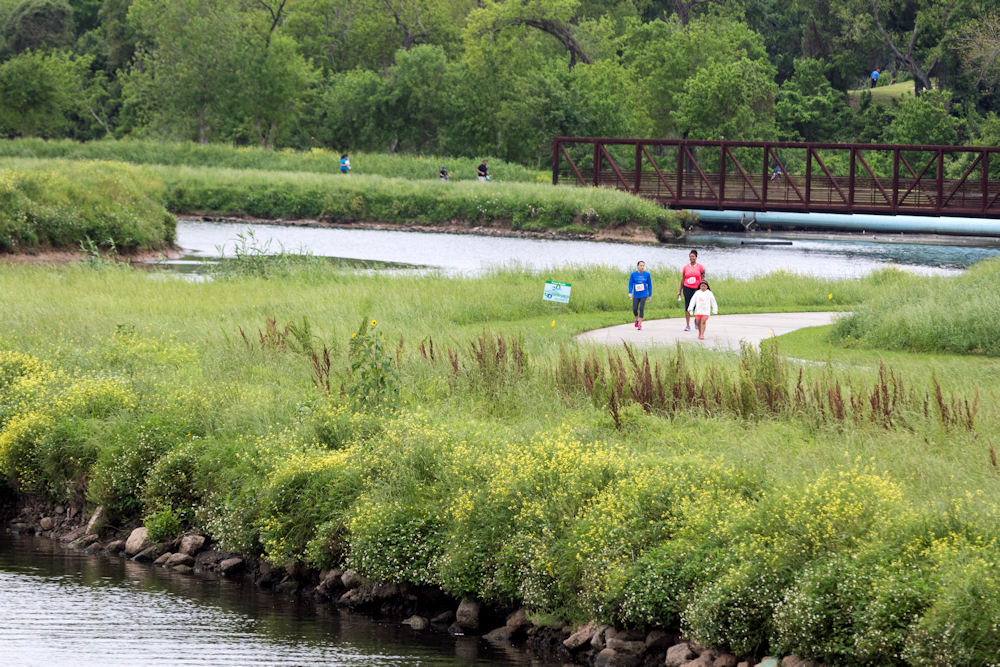
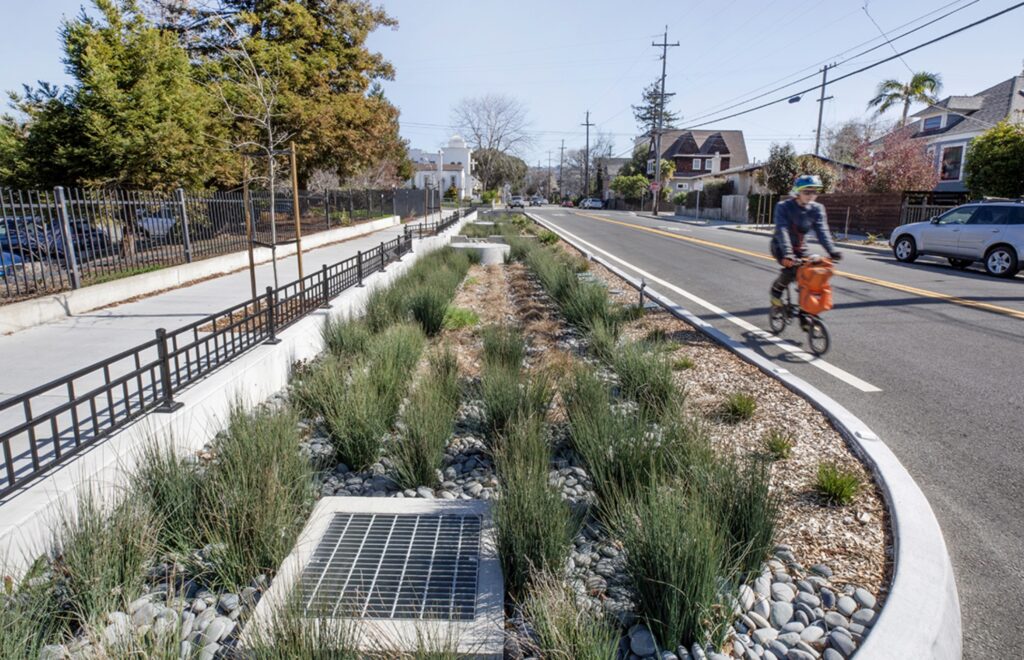
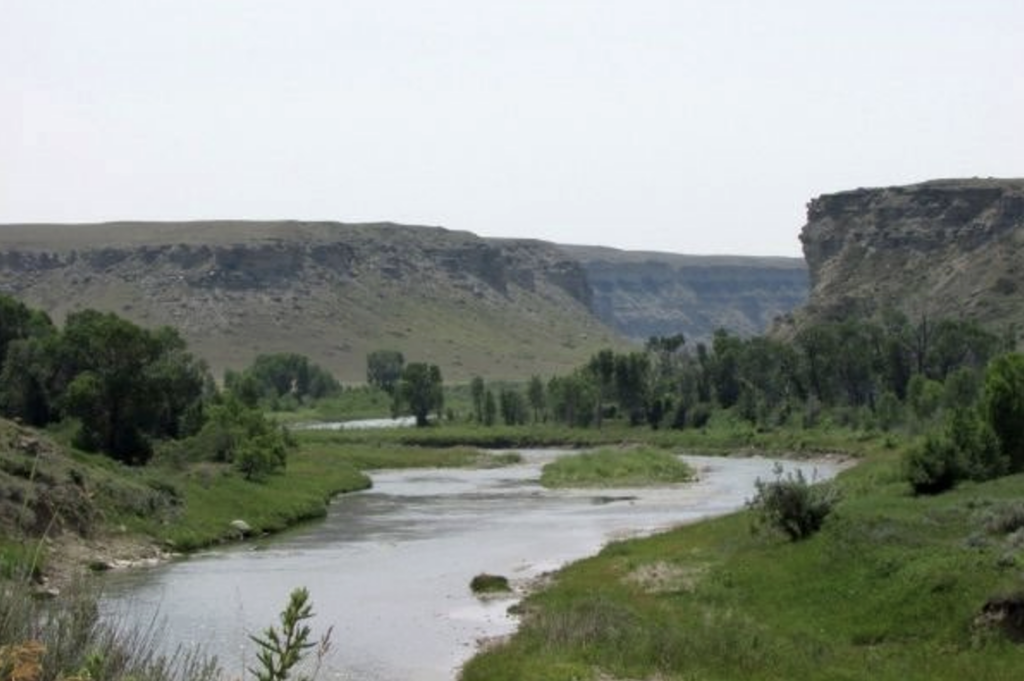
ATLAS OF INSPIRATION
The Atlas of Inspiration is a growing collection of climate infrastructure projects, planning strategies, and funding approaches that are already making an impact. From green infrastructure to affordable housing and resilient transportation, these projects show how communities across the country are addressing multiple hazards while improving daily life. Many of these ideas highlight how climate adaptation can inspire action, advance equity, and drive long-term systems to change.