
EXTREME WEATHER’S HIDDEN TOLL ON YOUR WALLET
One in four homeowners (26%) say they are not financially prepared to handle the costs if extreme weather damages their home and 15% of homeowners say they would not be able to pay their insurance deductible without going into debt if their home was damaged in an extreme weather event (Bankrate, 2024).
The financial impacts of extreme weather events on households strain savings, disrupt livelihoods, and deepen inequalities, adding to an already critical affordability crisis. Despite these events increasing in frequency, severity, and public visibility, households/individuals across the country are not financially prepared for the long term effects of weather such as sea level rise, nor the next weather disaster.
Understanding the magnitude of financial risks from climate shocks and stressors begins with understanding the different types of costs a household may incur. From property repairs and replacement, to spikes in energy bills, healthcare costs for mental and physical impacts, forced displacement and relocation, and insurance hikes – the list of household/individual costs can quickly compound to create or exacerbate insurmountable debt.
Governments can ease the escalating costs to communities by investing proactively in risk reduction and climate adaptation infrastructure. Every $1 invested in climate resilience and preparedness saves communities $13 in damages, cleanup costs, and economic impact today saves and every $1 not invested in disaster resilience today can cost communities up to $33 in lost future economic activity (U.S. Chamber of Commerce, 2024, U.S. Chamber of Commerce, 2025).
This collection of statistics is designed repository is a resource for communities, advocates, and practitioners working to understand and address the growing financial impacts of extreme weather.

“For many families, their home is their greatest and sometimes only source of wealth. When a family is displaced or that home is repeatedly damaged or lost, the impact can follow them for generations.”
— Zalyia Grillet, COO Brooklyn Level Up
CONSUMER PRICES ON THE RISE
GROCERY PRICES
Intense drought in California and Arizona alone contributed to an 80% increase in the cost of vegetables in November 2022 compared to the year prior (Climate Central, 2025). By 2035, higher temperatures are projected to cause food price inflation to increase between 0.9 and 3.2 percentage points per year (Communications, Earth & Environment, 2024).
UTILITY COSTS
Hotter summers have driven up the need for air conditioning, increasing the costs of cooling in the U.S. by more than 50% in the last decade (National Energy Assistance Directors Association & Center for Energy Poverty and Climate, 2024).
JOB STABILITY
More than 13 million jobs have a high vulnerability to climate extremes such as extreme heat and severe weather disruptions. Some of the most vulnerable job industries in the U.S. include agriculture, mining, heavy industry, and manufacturing (Deloitte, 2024).
FINANCIAL STABILITY AT RISK
Sea level rise, flooding, extreme heat, and other climate hazards affect where people live and raise housing-related costs. As land becomes less habitable due to climate change, rent, homeownership, and associated costs will increase.
- Climate change is projected to wipe out $1.5 trillion in U.S. home values over the next 30 years (CBS, 2025).
- Homeowners spent an average of $23 billion annually repairing damages from disasters from 2021-2023. The average restoration cost for a home after a disaster was $22,100 in 2023, up from an inflation-adjusted $17,900 two decades earlier (Harvard University Joint Center for Housing Studies, 2025).
- U.S. neighborhoods that were redlined – a practice that denied financial services to residents based on race – have a 25% greater risk of flooding and are 2.6°C (4.7°F) hotter as compared to non-redlined areas (Redfin News, 2021 & Climate, 2020).
- One in four U.S. homeowners say they are not financially prepared to handle the potential costs associated with extreme weather events in their area (Bankrate, 2024).
As extreme weather events increase in frequency and intensity, property & casualty insurance premiums have steadily risen across the nation forcing some policyholders to drop flood, auto, homeowners, and other types of insurance.
- When flood insurance rates increase, low-income Americans drop flood insurance, leaving families economically vulnerable to weather events (Journal of Catastrophe Risk and Resilience, 2025).
- Nationwide, insurance premiums are projected to rise 29.4% by 2055; in Miami, they could quadruple (CBS, 2025).
- Climate change is expected to hike homeowners’ insurance premiums nationwide by an average of 29.4% by 2055 (CBS, 2025). In 2025, the average premium was $2,397 per year and could be as high as $3,102 by 2055 (The Hartford, 2026).
- Insurance rates continue to rise. U.S. homeowners spent $21 billion more on homeowners insurance in 2024 than in 2021 (The Consumer Federation of America, 2025).
Damages caused by extreme weather can impact an individual’s livelihood such as credit scores and increased foreclosure rates, affecting both lenders and borrowers.
- As weather events grow more frequent and intense, direct impacts and resulting insurance premium increases could raise credit losses to $5.36 billion – nearly 30% of foreclosure losses – by 2035 (First Street, 2025).
- Properties flooded in extreme events face a 57% higher foreclosure rate than unflooded homes nearby (CNN, 2025).
- Weather-driven mortgage foreclosures could cause $1.2 billion in lender losses (First Street, 2025).
- After four years, a medium-sized disaster has caused an average 31-point decline in credit scores for people living in communities of color, whereas people living in majority white communities experienced a 4-point decline (Urban Institute, 2019).
The unequal impact of extreme weather
Extreme weather – both disasters & long term climatic changes – hits the most vulnerable communities the hardest, compounding their financial hardship and widening existing inequities. Low-income, historically underserved, and redlined communities often do not have a financial safety net or ability to miss work after a disaster, and have limited access to insurance, healthcare, and reliable transportation.
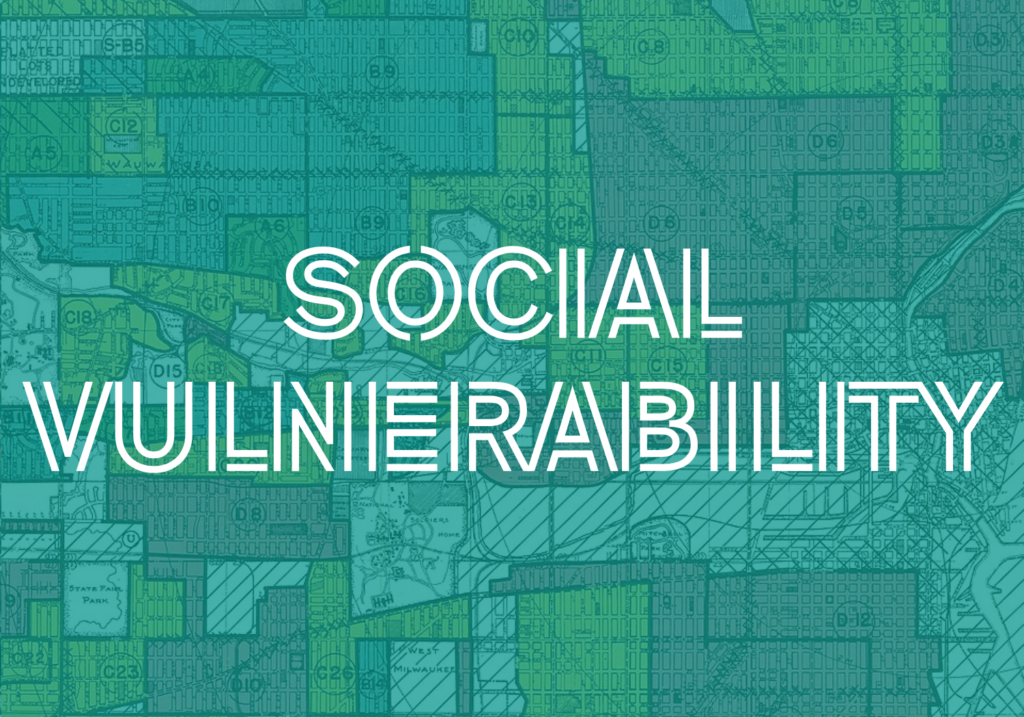
Socially vulnerable U.S. residents – those with greater susceptibility to harm from stressors like disasters due to demographic and socioeconomic factors such as poverty, lack of transportation, and crowded housing – are more likely to live in communities that are at greater risk to extreme weather events and sea level rise.
- Low-income neighborhoods can be as much as 12 degrees hotter during a heat wave than nearby wealthier neighborhoods and experience higher rates of extreme heat-related illness (American Progress, 2025)
- Lower-income neighborhoods have a higher cumulative chance of flooding over a 30-year period (40.6% compared with 35.4 percent), a higher average annual expected loss per property ($1,037 compared with $780), and a greater share of high-risk properties (7.6% versus 6.8%) (Fed Communities, 2024).
- Almost one in four Americans are socially vulnerable and have low resilience to extreme heat exposure (US Census, 2023).
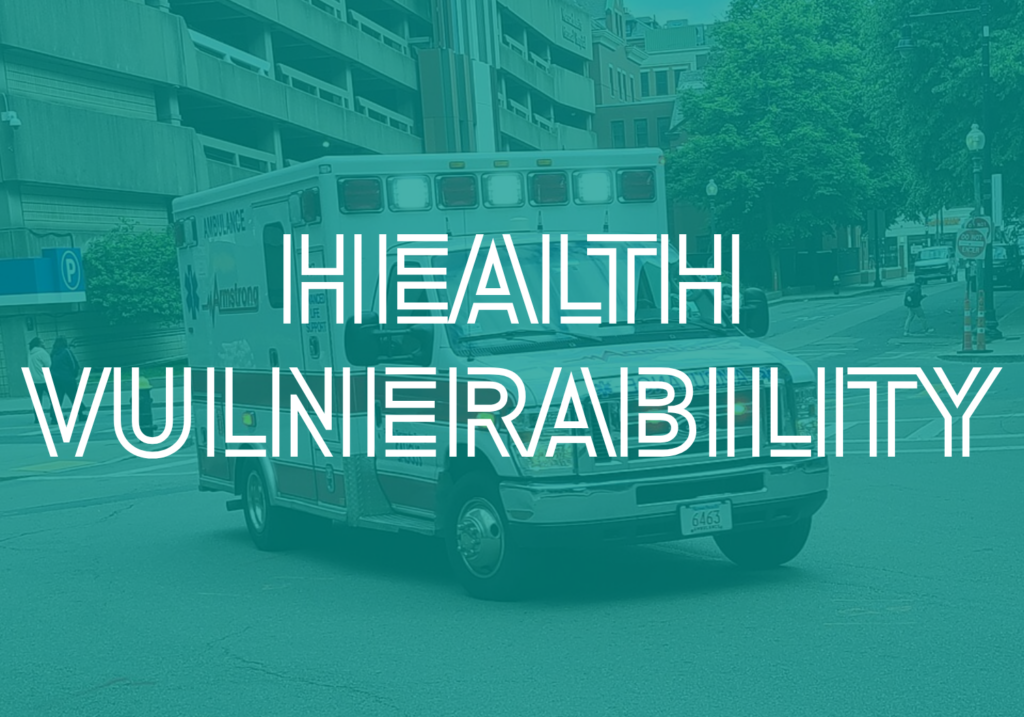
The effects of extreme heat, air quality, and flooding can affect Americans’ health leading to growing medical and prescription costs.
- Low-income individuals are 11% more likely to live in areas with the highest projected increases in deaths related to extreme temperatures (EPA,2021).
- In the US, 94% of urban areas show consistent patterns of racialized Urban Heat Island effects (Climate, 2020).
- Extreme heat kills more people in the U.S. each year than all other extreme weather events combined (American Public Health Association, 2025). Heat-related deaths increased from 2,670 between 2000 and 2009 to 4,000 between 2010 and 2020 (Yale School of Public Health, 2025).
- Extreme heat could be responsible for almost 235,000 emergency department visits and more than 56,000 hospital admissions for heat-related or heat-adjacent illness, adding approximately $1 billion in health care costs each summer (Center for American Progress, 2023)

Extreme weather events can drive internal migration through displacement, reducing availability of safe, affordable land and housing, while also accruing the costs of moving.
- Sea-level rise could displace as many as 13 million coastal residents (New York Times, 2020).
- One in 12 Americans in the Southern half of the country will move toward California, the Mountain West or the Northwest, (Journal of the Association of Environmental and Resource Economists, 2018).
- Climate-related migration from extreme heat, wildfires, and flooding will have 55 million Americans relocating within the U.S. over the next 30 years (First Street Foundation, 2025).
- Up to 50% of New York City residents and 55% of New Jerseyans are at risk for primary or secondary displacement from flooding (Rebuild by Design, 2022, 2024).
CASCADING HEALTH IMPACTS OF EXTREME WEATHER EVENTS
This visual shows how climate events lead to immediate health impacts as well as longer-term health vulnerabilities. These impacts cost people for prescriptions, medical treatments, and hospital stays.
TAXPAYERS ARE ALREADY FOOTING THE BILLS FOR SEVERE WEATHER
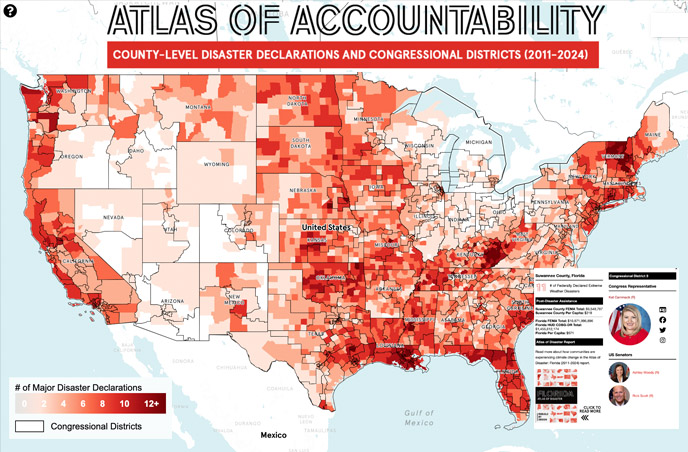
Between 2011 and 2024, 99.5% of congressional districts experienced at least one federally declared major disaster due to extreme weather, affecting communities across political, urban-rural, and socioeconomic lines. These events, fueled by climate change, cost taxpayers $117.9 billion in federal relief—$72.7 billion from FEMA for hazard mitigation (HM) and public assistance (PA), as well as $45.2 billion from HUD’s Community Development Block Grant – Disaster Recovery (CDBG-DR) program.
Learn how these costs accrue to taxpayers and different solutions to reduce risk in our Atlas series below:

ATLAS OF DISASTER REPORT
Released in 2022, the Atlas of Disaster offers a county-by-county snapshot of climate-driven disasters across the U.S. from 2011–2021. The report highlights widespread impacts, gaps in federal policy, and the urgent need for pre-disaster investment in both physical and social infrastructure. Read the report >>
ATLAS OF ACCOUNTABILITY TOOL
The Atlas of Accountability maps federal disaster declarations and post-disaster assistance obligations for every county in the U.S., with overlays by congressional district between 2011-2024. Explore the map >>

CLIMATE INFRASTRUCTURE WE LOVE
Explore a growing collection of climate infrastructure projects, planning strategies, & funding approaches That are currently helping communities across the U.S. build resilience. Get inspired >>
SHARE YOUR STATE & STORY
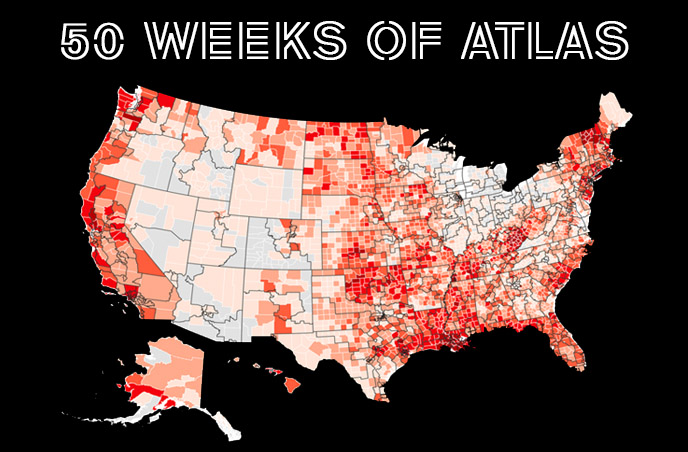
Each week in 2025, we shared a key finding from the Atlas for all 50 states through downloadable graphics and captions. Explore your state’s climate risk data and help spread awareness by sharing it on social media. Download state >>
Image Credits: Image 1: formulanone via Flickr; Image 2: Kate Webster via Flickr; Image 3: respres via Wikimedia Commons; Image 4: National Archives via Wikimedia Commons; Image 5: Mangocove via Wikimedia Commons; Image 6: Bellhopsmarketing via Wikimedia Commons.
If there are additional facts that should be included, please email info@rebuildbydesign.org.