Parks Save Cities. Parks Save Lives.
New York City’s Parks are not just recreational spaces—they are vital infrastructure that can protect communities, reduce urban heat, and manage stormwater, especially if they are designed well and properly maintained. Our analysis of New York City’s 2,385 parks reveals a concerning trend: 38% are currently in flood zones and that number is projected to surge to nearly 70% by 2100.
We can reverse this trend, but only if we treat parks as vital infrastructure that must be improved and maintained — the way we consider roads and bridges. Parks can save cities from climate disaster, protecting lives and property.
According to the Rebuild by Design and Ramboll study, Blue-Green Infrastructure: a New Business Case for New York City, a blue-green infrastructure network designed for a 10-year storm in 2050 can generate a 2:1 return on investment by reducing damages, avoiding cleanup costs, and increasing long-term resilience. Today there are 1.4 million people living in the City’s floodplain. That number will rise to over six million by 2100. Climate change is here, but if we properly invest, upgrade, and prepare we can unlock the superpower of parks.

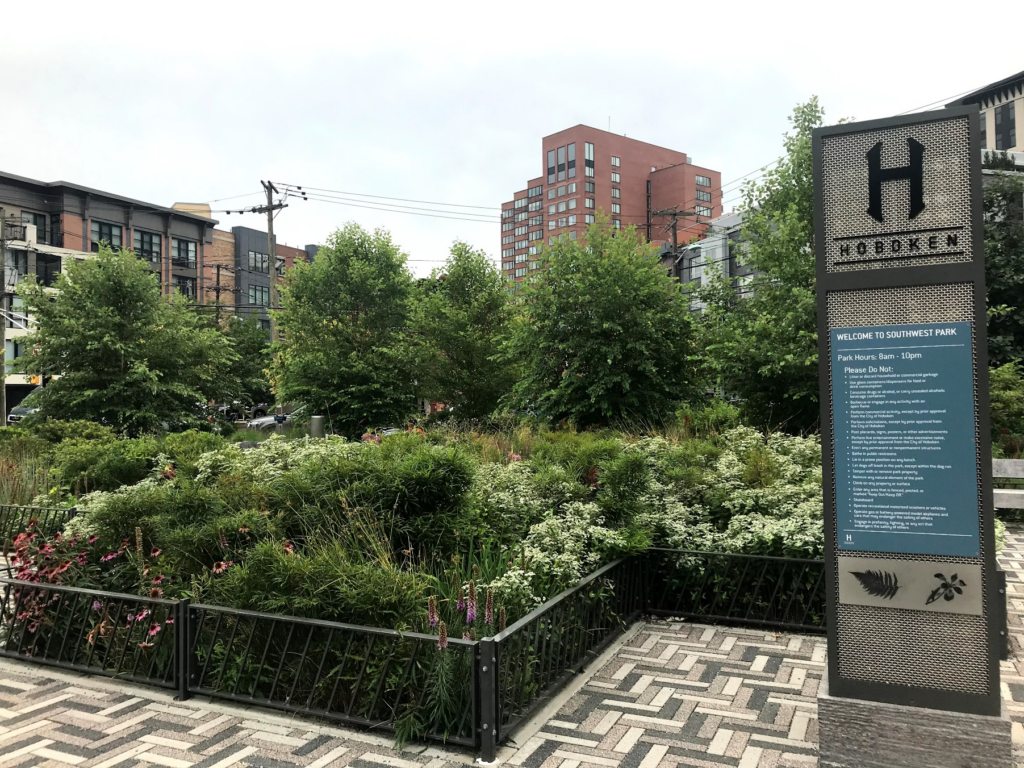
Hoboken’s ResilienCity Park: A Blueprint to Rainproof Parks Across NYC
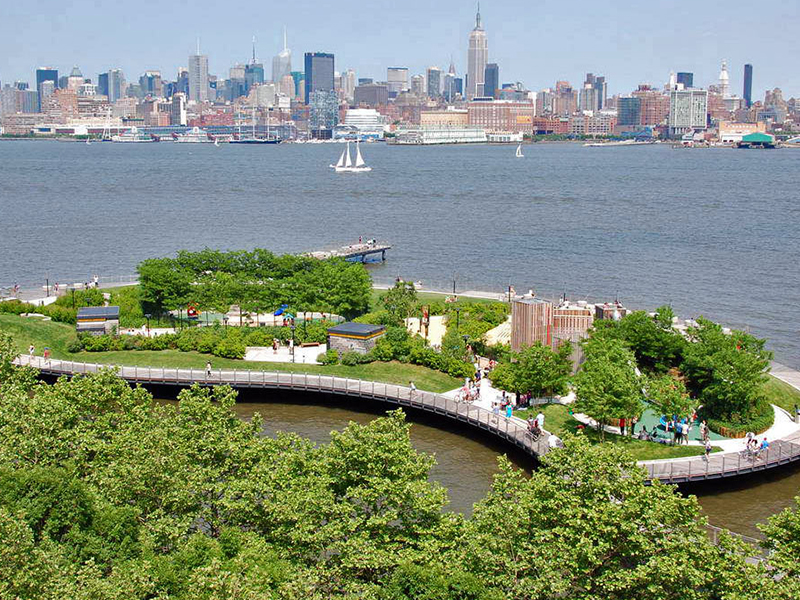
For proof in action, New Yorker’s need only look across the Hudson River. The City of Hoboken, through its Hurricane Sandy Rebuild by Design project reduced flooding by 88% by investing in green and gray infrastructure to capture and slow stormwater before it floods. Hoboken’s parks use a mix of interventions that can hold a combined 4.2 million gallons of heavy rain during a single event.
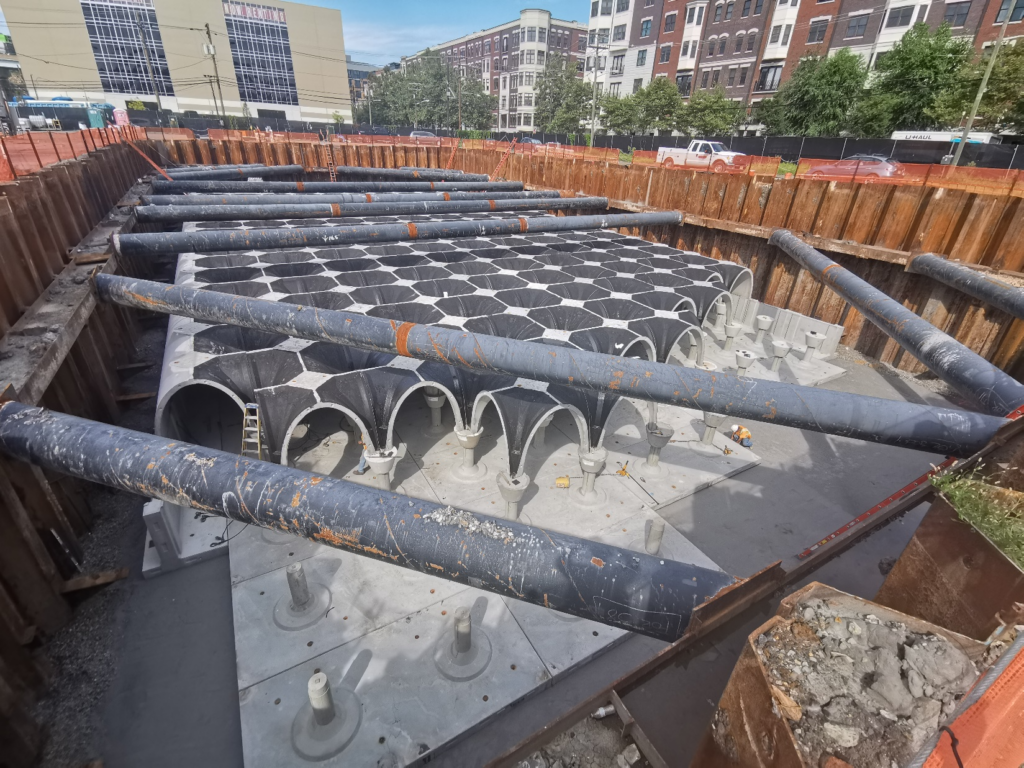
Northwest Resiliency Park features underground pumps and large storage tanks that manage stormwater during heavy rains. These systems collect runoff from 20 surrounding blocks, helping keep the adjacent neighborhood dry. Green infrastructure, like rain gardens and bioswales, and permeable surfaces keep the park itself functional during periods of increased rain. New York should follow this model, upgrading and building similar parks to address citywide flooding.
This new understanding of parks’ crucial role in flood protection can bring additional funding for capital and maintenance. Parks manage 14% of the City’s land, but only about 0.6% of the City budget over the past 40 years, far below the national standard of 1-2% allocation of a municipality’s budget. Parks offer immense potential to draw down federal and state funds, including programs from FEMA, HUD, and state funding. If the City were to recognize parks as vital infrastructure—as it does highways—and properly invest in upgrading and maintaining its parks, these public spaces could protect and save lives and save billions of dollars. Redesigned parks serve as stormwater mitigation sites, flood buffers, cooling hubs and more.
NYC PARKS IN FLOOD RISK INTERACTIVE MAP
Explore our interactive map analysis to discover how strategic investments in parks infrastructure can create powerful neighborhood infrastructure that can address extreme weather, ensuring a safer and more resilient future for all New Yorkers.
FINDINGS
70% OF NYC PARKS VULNERABLE TO FLOODING IN 2100
Nearly 70% of New York City’s parks are projected to be in stormwater and storm surge flood zones by 2100, compared to 38% (916 of 2,385 parks) today.
BROOKLYN PARKS TO SEE 48% INCREASE IN FLOOD ZONE COVERAGE
In Brooklyn, 21% of parks are in stormwater and storm surge flood zones today, projected to surge to 69% by 2100—the steepest increase among all boroughs.
NEARLY 80% OF QUEENS PARKS WILL BE AT RISK BY 2100
Currently, 33% of Queens’ 556 parks are in stormwater and storm surge flood zones, with projections rising to nearly 78% (431 parks) by 2100.
40% OF NYC PARKS IN SOCIALLY VULNERABLE COMMUNITIES TO FLOOD
Over 40% of parks located in stormwater and storm surge flood zones are in neighborhoods with high social vulnerability, meeting or exceeding FEMA’s high-risk thresholds.
33% OF FLOOD-PRONE PARKS ALSO FACE EXTREME HEAT RISK
Approximately 33% of parks in stormwater and storm surge flood zones are also in the highest heat risk areas, placing them in the top quintile for heat-related impact, compounding risks for the communities that rely on them.
177 HIGH PRIORITY PARKS
are located in current or future flood zones with the highest heat (HVI = 5) and social vulnerability (SVI ≥ 0.90) scores. Nearly 60% of these parks are in the Bronx, followed by Brooklyn, Manhattan, and Queens. Click here for the list >>
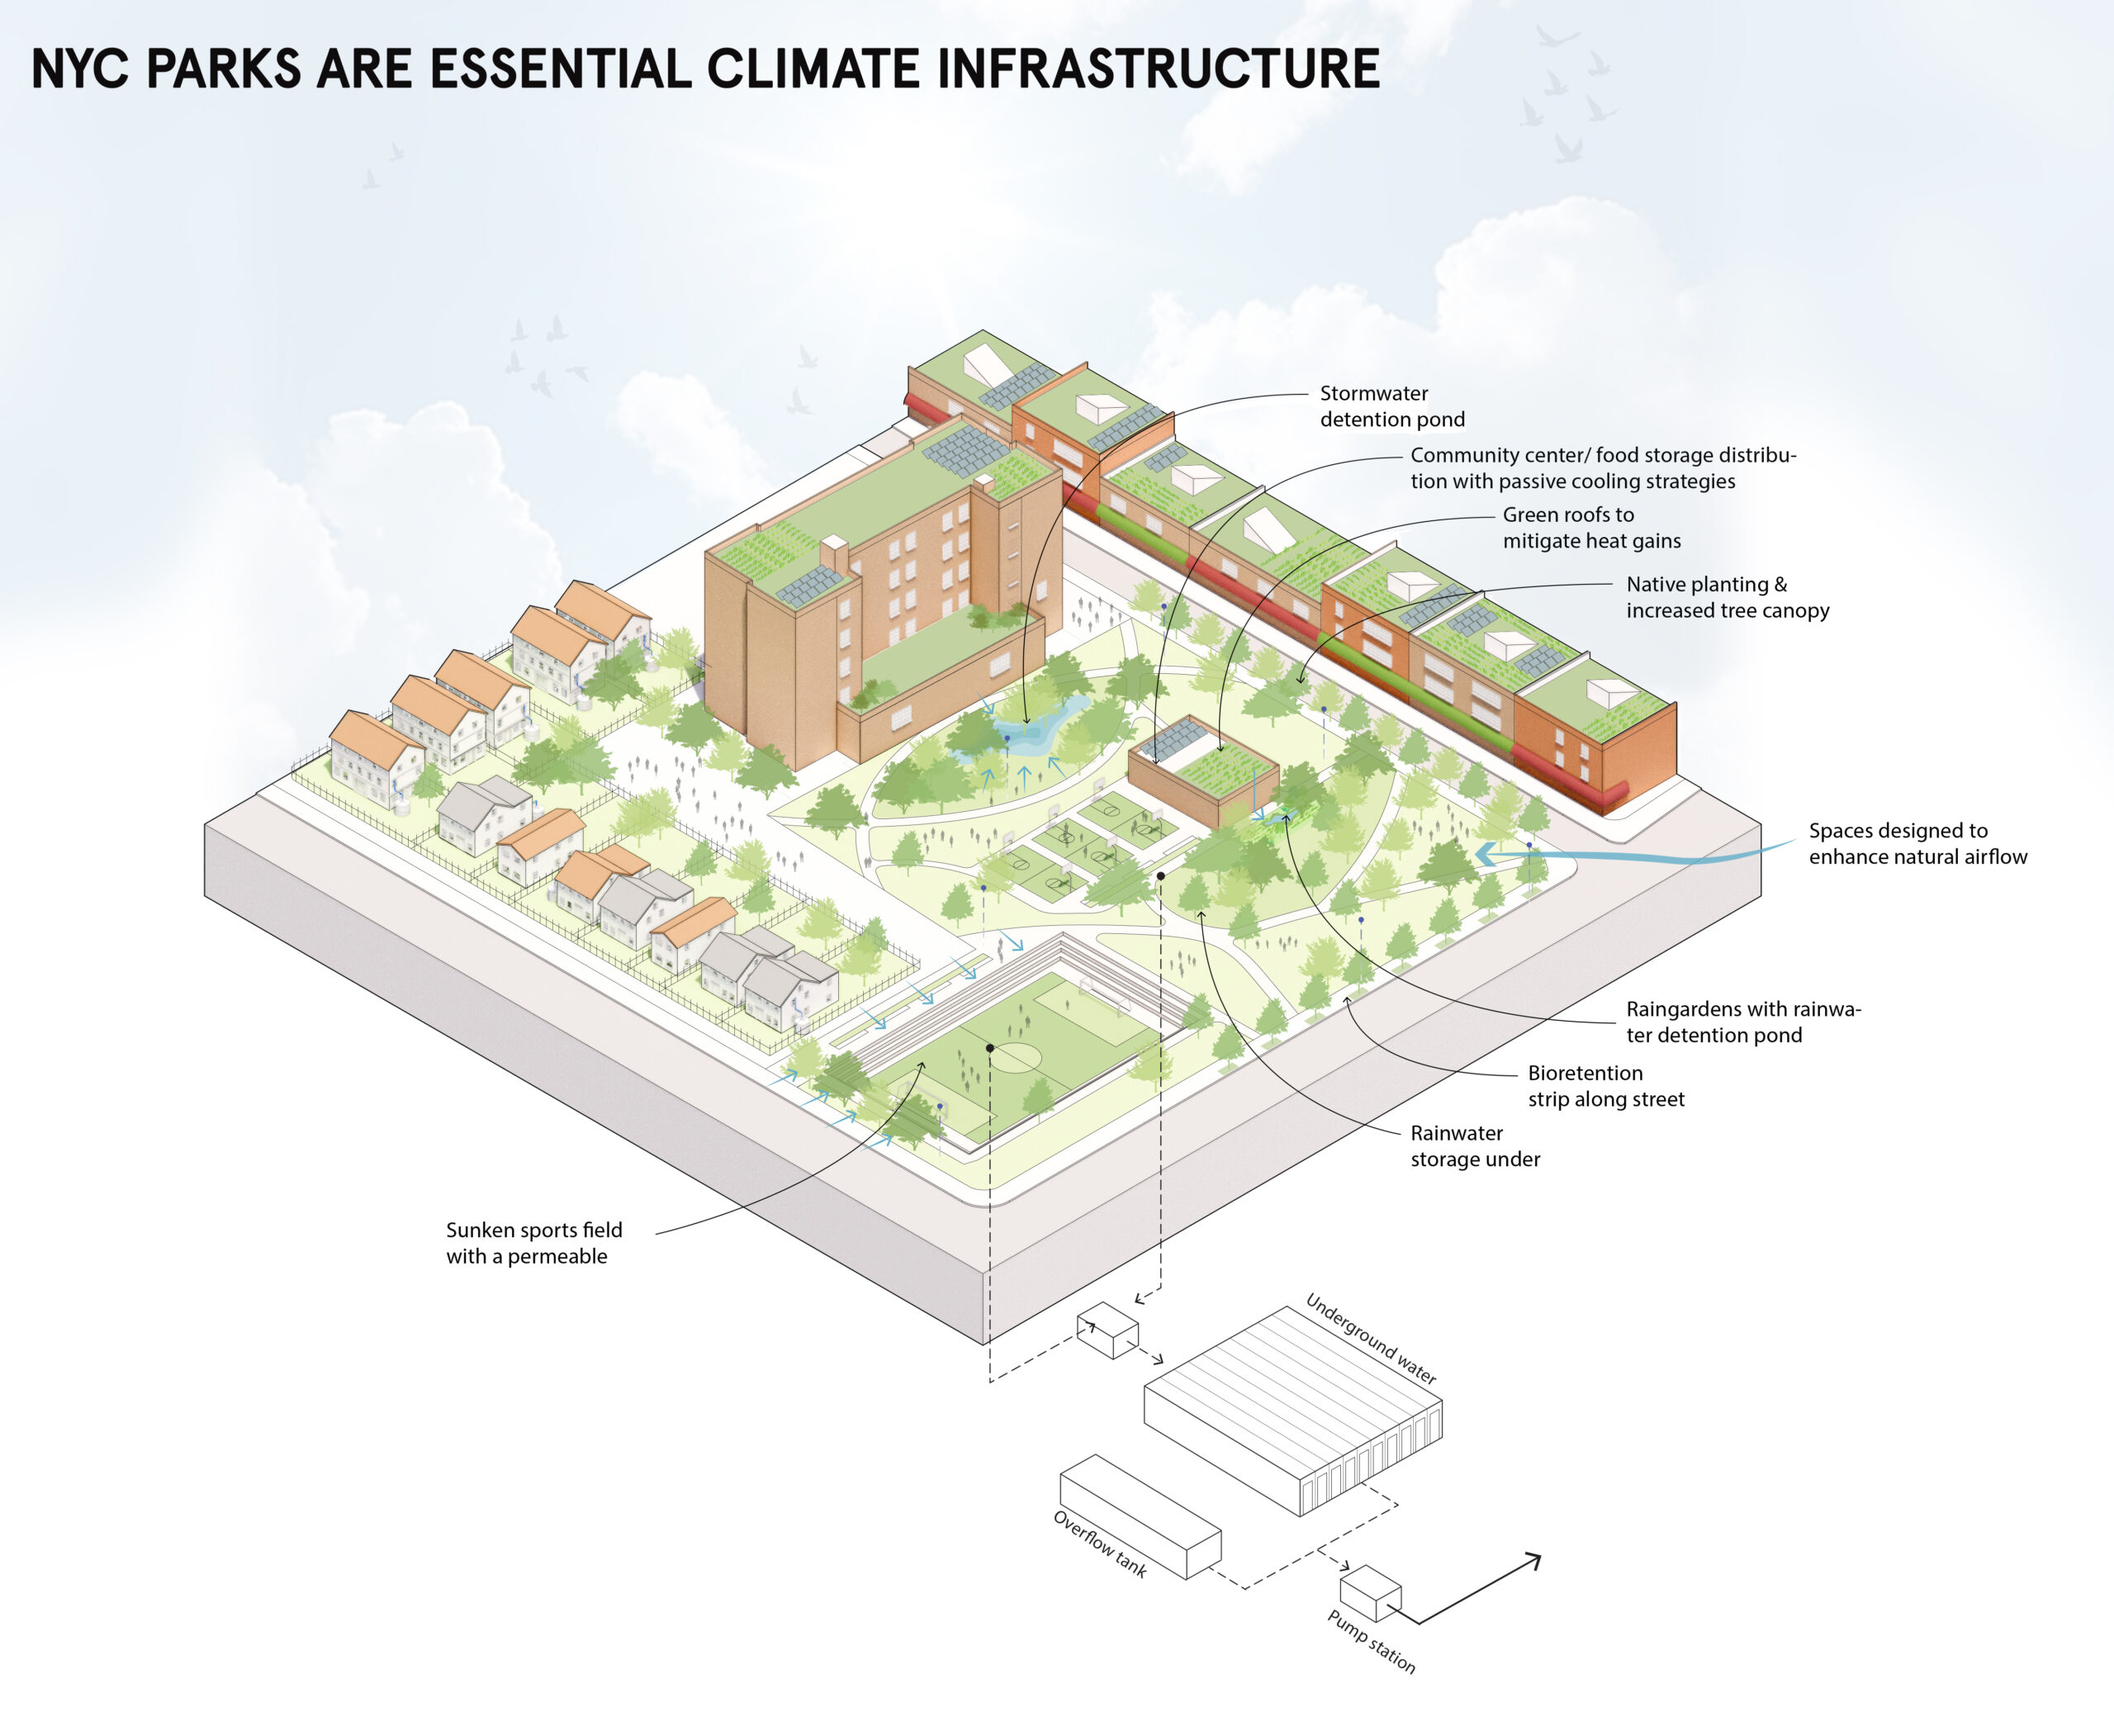
TYPES OF CLIMATE INFRASTRUCTURE FOR PARKS
COMPREHENSIVE WATER STRATEGY
Incorporates the Resist, Delay, Store, Discharge approach subsurface holding tanks, pumps, and barrier systems to manage storm surges slows, stores and discharges excess water parks accessible to reduce flood damage to communities.
GREEN STORMWATER INFRASTRUCTURE
Integrates rain gardens, bioswales, and permeable pavements to capture and filter rainwater. This system reduces runoff, minimizes localized flooding, and eases pressure on aging drainage systems—protecting both park areas and surrounding neighborhoods.
TREE CANOPY & URBAN COOLING
Expands tree cover and incorporates water features and reflective surfaces to lower urban temperatures. This natural cooling not only enhances park comfort but also mitigates the urban heat island effect, benefiting public health.
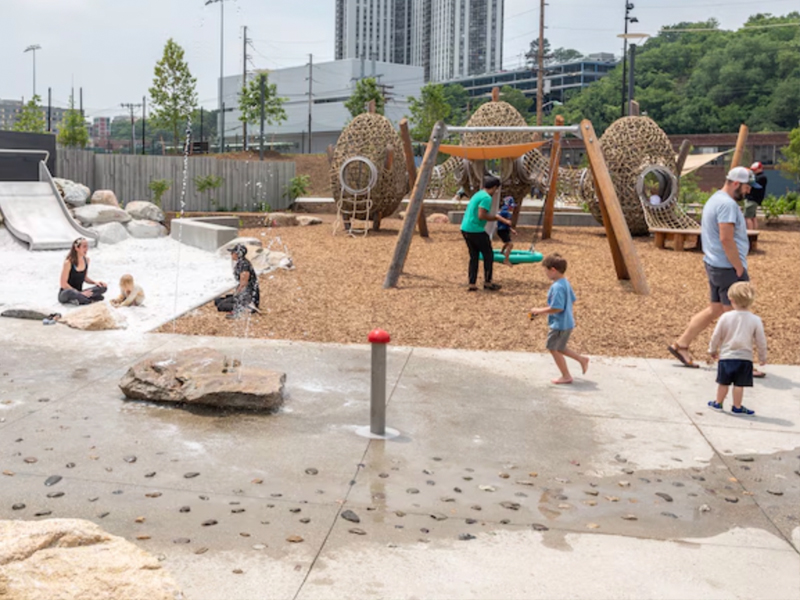
COMMUNITY RESILIENCE HUBS
Transforms parks into multipurpose spaces that serve as emergency response centers. Equipped with cooling areas, charging stations, and storage for vital supplies, these hubs enhance community cohesion and provide critical support during disasters.
TURNING VISION INTO ACTION

HOBOKEN NEW JERSEY WALKING TOUR
Explore how Hoboken transformed its parks and streets into a citywide flood defense system. This self-guided tour highlights innovative “Resist, Delay, Store, Discharge” solutions that manage stormwater at every level, showing how an urban center can thrive despite intensifying climate threats. Click here to explore >>
BUSINESS CASE FOR BLUE-GREEN INFRASTRUCTURE
Check out the 2023 Rebuild by Design and Ramboll report, revealing a 2:1 return on every dollar invested in Blue-Green Infrastructure. Learn how these nature-based solutions drastically reduce flood damages, lower recovery costs, and enhance neighborhood livability—benefiting both residents and local economies. Click here to read >>
RAINPROOF NEW YORK CITY
Discover how strategic investments in green infrastructure can turn the concrete jungle into a sponge that effectively manages rainwater. This resource explores cutting-edge methods to mitigate flooding, reduce the heat island effect, and bolster community resilience across New York City. Click here to read >>
RECOMMENDATIONS
1. Expand Parks’ Capacity to Manage Neighborhood Flooding: Utilize parks to reduce neighborhood flooding by implementing green and gray stormwater management solutions in all park development and redevelopment projects. Gray infrastructure will capture and temporarily store floodwater to safely discharge at a safer time. This necessitates expanding the City’s flood management toolkit to include large-scale solutions such as subsurface storage tanks, conveyance systems, and basins.
2. Properly Fund Parks Operations and Maintenance: Dedicate at least 1% of NYC’s expense budget for parks, in keeping with minimum national standards— many cities invest a higher percentage in parks.
3. Adopt an Inter-Agency Funding Model for Parks’ Climate Infrastructure: Coordinate with agencies like DEP, DOT, and FEMA to co-fund infrastructure projects where parks serve multiple climate protection purposes, such as management stormwater, reducing heat, and supporting emergency response. Identify opportunities for park infrastructure and maintenance funding from agencies to implement and maintain green-gray solutions.
4. Invest in Public Realm Stormwater Retention and Detention: Where neighborhood parks are unable to manage stormwater or there is a lack of open space, invest in stormwater solutions in streets, sidewalks, plazas, and schoolyards to manage capacity in the public realm.
5. Outfit Parks with Disaster Response and Recovery Staging: Recognizing that parks already serve as de facto disaster response hubs, all redesigns should include community resources that can be utilized during disasters, backup power charging stations, emergency supply storage, and dependable wifi. Offer community gathering spaces in viable parks that can strengthen social resilience during non-emergency days and serve as hubs for sharing information, resources, and supplies during extreme weather.
METHODOLOGY
Rebuild by Design analyzed 2,385 City and State-Owned Parks from TPL’s database to identify parks on or near current and future stormwater and storm surge flood zones. A 100-foot buffer was applied to show how flooding in or near parks can impact nearby neighborhoods and infrastructure.
- Trust for Public Land’s ParkServe Dataset: Provides data on city and state-owned parks across U.S. cities, highlighting park access and amenities to identify areas needing more recreational spaces.
- 2020 Storm Surge Flood Zones: Areas with a 1% annual risk of storm surge flooding as of 2020, within the 100-year floodplain.
- 2020 Stormwater Flood Zones (Limited): Current areas at risk of flooding from heavy rainfalls and poor urban drainage, assessed in 2020.
- 2050 Storm Surge Flood Zones: Future predictions of areas within the 100-year floodplain at risk of storm surge flooding by 2050.
- 2050 Stormwater Flood Zones (Moderate): Predictions of areas at risk of moderate stormwater flooding by 2050, representing rainfall events with an intensity of approximately 2 inches per hour, which have a 10% annual chance of occurrence. These projections account for an estimated 2.5 feet of sea level rise.
- 2100 Storm Surge Flood Zones: Projections for storm surge flooding in 2100, using climate change data from the NYC Panel on Climate Change.
- 2080 Stormwater Flood Zones (Extreme): Forecasts of areas likely to experience severe stormwater flooding by 2080, representing rainfall events with an intensity of approximately 3.5 inches per hour, corresponding to a 1% annual chance of occurrence. These projections include an estimated 4.8 feet of sea level rise.
- 2020 Heat Vulnerability Index (HVI) from DOHMH: Highlights neighborhoods at greater risk of heat-related illness or death due to factors like air conditioning access and surface temperatures.
- 2022 Social Vulnerability Index (SVI) from CDC: The SVI uses 15 indicators (e.g., income, housing, and language barriers) to measure a community’s ability to prepare for and recover from disasters.
- High priority parks are located within current or future floodplains and exhibit the highest heat (HVI = 5) and social vulnerability (SVI ≥ 0.90) scores, making them crucial for protecting vulnerable communities.