FLOOD RISK = FINANCIAL RISK
Today, New Jersey faces rising flood risk — putting $277.7 billion in property value and $3.2 billion in annual tax revenue at risk.
FINDINGS
1.3 Million Residents Will Live in High Flood Risk Areas by 2050
Currently, 624K New Jersey residents live in areas at high risk of flooding. By 2050, that number will increase to 1.3 million residents, including 650,000 lower-income individuals who may not have the resources to relocate.
By 2050, Nearly 1 in 6 Parcels Overlap with 100-Year FloodPlain
In the next 25 years, 565K parcels—or 16.4% of properties statewide—will be exposed to major flood risk, threatening $435.9 billion in (today’s) market value.
$5.9 Billion in Property Tax Revenue Is at Risk
Parcels at high flood risk in 2050 currently generate more than $5.9 billion in annual property taxes. As flooding worsens, the loss of this revenue could undermine the state’s fiscal health and local public services.
In Cape May, the non-renewal rate tripled
Cape May has one of the highest projected property values at risk in New Jersey, with $68.2 billion in property value potentially exposed to flooding by 2050. It also saw the steepest rise in home insurance non-renewals, with rates tripling since 2018 (Senate Budget Committee, 2024).
NEW JERSEY'S RISK TO DISPLACEMENT & ECONOMIC EXPOSURE DUE TO FLOODING
As sea levels rise and storms intensify, New Jersey faces mounting risks to its homes, communities, and economy. By 2050, it is estimated that nearly 1.3 million New Jerseyans will live in high flood risk Parcels with at least 50% of land area overlapping both the current and projected 100-year floodplain. This analysis focuses on coastal and fluvial flooding. areas; half of those people are lower income Based on HUD’s 2024 definition for New Jersey ($97,800 for a 4-person household). residents who may lack the resources to move out of harm’s way. Nearly 1 in 6 parcels Defined as the smallest unit of land with a unique boundary used for property tax assessment and mapping. Parcels include both privately owned and publicly owned properties, as recorded in the state’s tax system. statewide will be exposed to high flood risk, threatening $435.9 billion in (today’s) property value and $5.9 billion in annual property tax revenue.
The findings reveal how flood exposure intersects with economic inequality and the risk of displacement due to extreme weather and sea level rise in New Jersey. This parcel-level analysis covers all 3.4 million properties statewide, including residential, commercial, and industrial parcels, to reflect the full scope of New Jersey’s exposure. Each parcel is classified into one of four displacement risk groups, showing who is most likely to relocate, and where they are likely to move, putting further pressure on a constrained real estate market that has a vacancy rate of 0.5% for homeowners and 3.6% for renters (St. Louis Fed, 2024).
This growing divide between who is able to stay in their homes and who may need to move has major implications for land use, infrastructure, insurance, and equity. Addressing it will require bold investment and long-term planning—from buyouts and bond acts to insurance reform and the development of new affordable housing to welcome New Jerseyans who need to move away from high-risk areas.
We can't wait any longer.
Who faces the greatest risk of displacement?
While every county in New Jersey will likely experience more frequent storms and face higher flood risk, the burden won’t be shared equally. This table shows how flood exposure intersects with income, by classifying residents into four displacement risk groups—those with the least resources are the most likely to be displaced. Understanding these population-level vulnerabilities is essential for designing solutions.
Tip: Click on any column header to sort the below tables.
High Flood Risk = HIGH FINANCIAL RISK
Flooding is already reshaping financial realities across New Jersey. Today, 565K parcels representing $277.7 billion in property value and $3.2 billion in annual tax revenue are at risk of flooding. By 2050, more than $435.9 billion in (today’s) property value and nearly $6 billion in annual property tax revenue could be at risk from rising seas and more severe storms.
Tip: Click on any column header to sort the below table.
INSURANCE NON-RENEWAL RATES ARE HIGHEST IN COMMUNITIES WITH GREATEST FLOOD-RISK EXPOSURE
Insurance non-renewals across New Jersey are highest in counties facing growing risks due to climate hazards, reflecting a national trend. A 2024 investigation by the Senate Budget Committee analyzing data from two dozen insurance companies, accounting for about 65% of the homeowners insurance market, found that “the states and counties most exposed to climate-related risks, like wildfires or hurricanes, are among those with the highest non-renewal rates and the highest growth in non-renewal rates.”
The chart to the right tracks county-level changes in non-renewal rates in New Jersey from 2018 to 2023, providing early signs of market destabilization. Counties like Cape May, Hudson, Ocean, and Atlantic on average have higher non-renewal rates and experienced some of the steepest increases in comparison to counties with lower risk to severe storms and flooding. For instance, in Cape May, the non-renewal rate tripled, rising from 0.47% in 2018 to 1.45% in 2023. As coverage declines, more households may be left financially exposed in the face of future flood events.
Tip: Click on a county using the legend or hover over the line graph to isolate specific county data.
RECOMMENDATIONS
1) Fund Resilient Infrastructure to Make Communities Safer: Create reliable state funding sources to adapt to sea level rise, severe storms, and extreme weather. New Jersey can raise state-level funds through a bond act or minimal surcharge on certain types of insurance to buy-down risk.
2) Help Families Relocate Away from Risk: Expand funding for New Jersey’s Blue Acres voluntary buyout program to acquire homes in high-flood-prone and repetitive-flood zones, and provide case management support and social services to households opting to relocate. Such efforts restore natural floodplains and reduce future recovery costs.
3) Plan for Short- and Long-Term Migration: Develop long-term strategies for managing local migration, ensuring displaced residents have access to housing, jobs, and resources in safer areas. This approach should integrate economic mobility and housing access, addressing the growing challenges of climate-induced displacement within New Jersey and from other regions.
METHODOLOGY
Rebuild by Design analyzed county-level flood risk, population vulnerability, and economic exposure across New Jersey using parcel-level property data, current and projected floodplain extents, tax assessments, and census demographics.
Parcels were classified as high flood risk if ≥ 50% of land area overlapped both the current and projected 100-year floodplain. A 100-year flood has a 1% annual chance of occurring; over a 30-year mortgage, structures in these areas face a 26% chance of flooding at least once (FEMA).
- Current 100-year floodplain is based on the Rutgers NJ FEMA Modified Statewide Flood Hazard Area (2023) dataset, which includes both effective and preliminary FIRM data.
- Projected 2050 100-year floodplain is based on the Rutgers NJ Inland Design Flood Elevation (FEMA 1% Chance Annual Flood + 3 ft) (2024).
Parcel geometries were repaired and coastal/riverine water areas removed before calculating land-area overlap to avoid overstating exposure.
Parcel-level tax assessments were sourced from the MOD-IV system. Assessed values were converted to market value using the county-level Equalizer Ratio (NJ Division of Taxation, 2024).
Population data came from 2020 Census blocks. Median household income (ACS 2022 B19013) was assigned by block group.
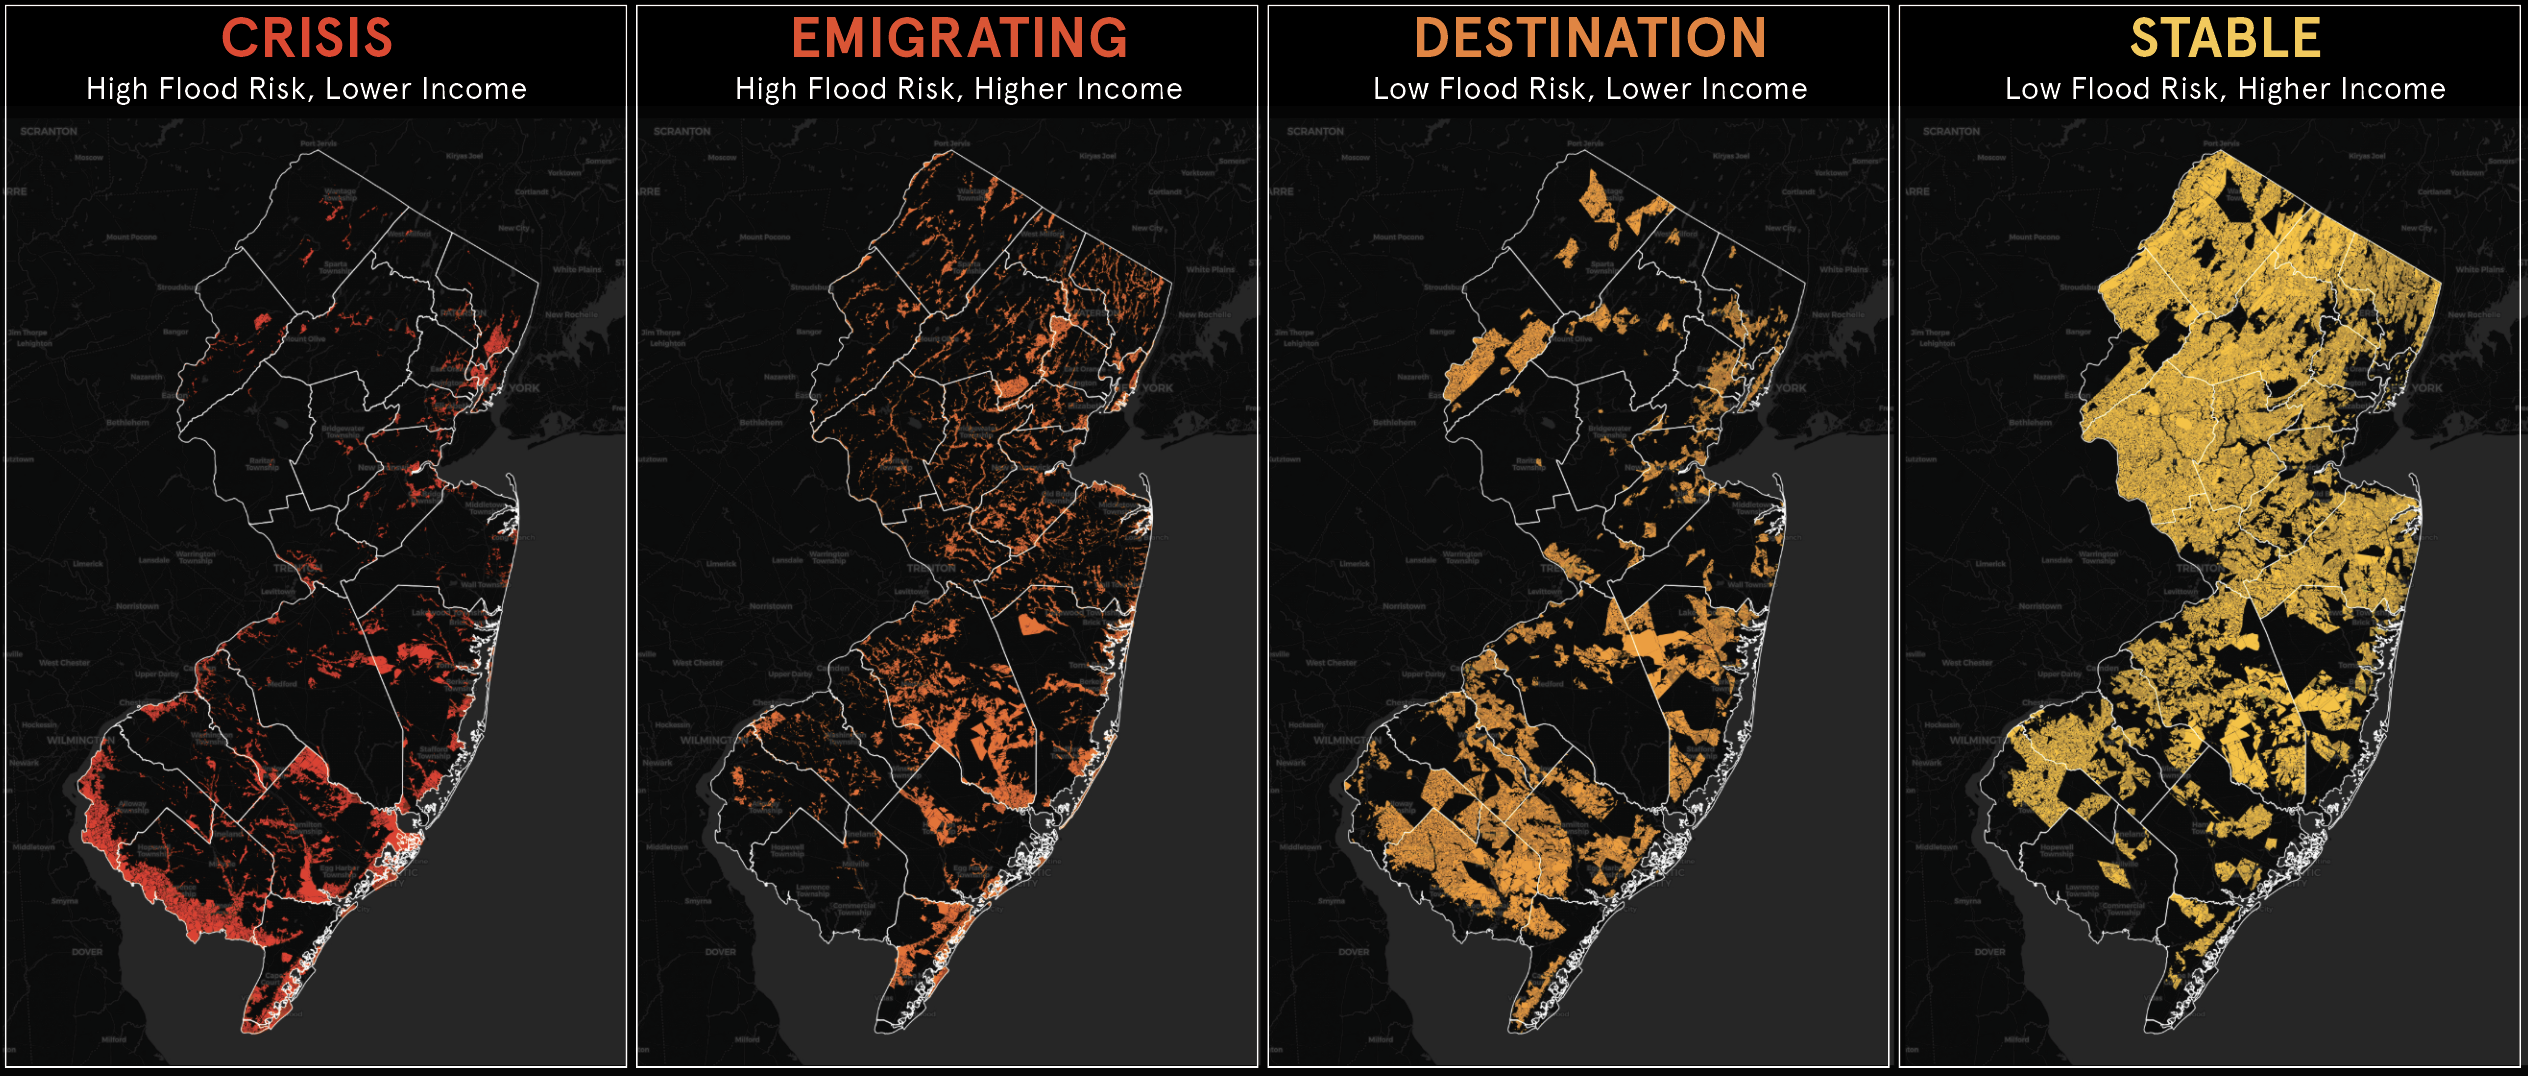
Parcels were sorted into four groups (high flood risk = ≥ 50% inundation; lower income = ≤ $97,800):
- Crisis: High flood risk & lower income
- Emigrating: High flood risk & higher income
- Destination: Low flood risk & lower income
- Stable: Low flood risk & higher income
Lower income is defined as ≤ $97,800 (HUD 2024, 4-person household).
Homeowner-insurance non-renewal rates (2018–2023) were analyzed using Federal Insurance Office data to track coverage loss related to flood and climate risk.