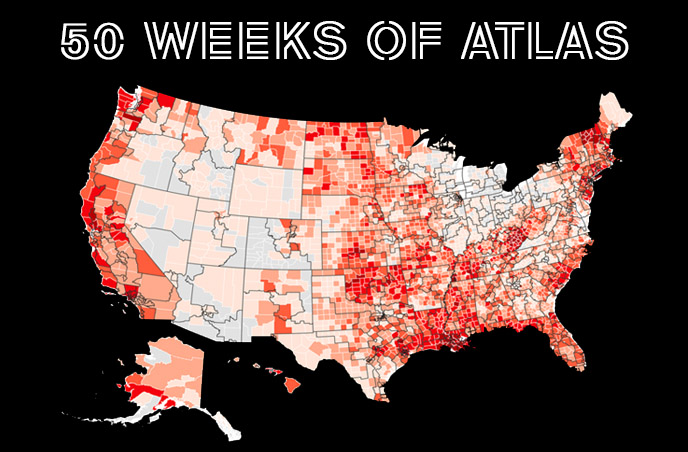
50 STATES | 50 FACTS | 50 WEEKS SOCIAL MEDIA CAMPAIGN

In 2024, Rebuild by Design launched the 50 States | 50 Facts | 50 Weeks social media campaign to bring national attention to the true scope of climate impacts in the United States. Each week, we shared data-driven graphics highlighting how every state has been affected by federally declared disasters—ranging from hurricanes to wildfires to extreme heat—and the billions in recovery costs paid by taxpayers.

These state-level facts are drawn from the Atlas of Accountability, our interactive tool that tracks disaster declarations and federal funding from 2011 to 2024. By breaking the data down by state, we give advocates, local leaders, and everyday residents a way to see and share what’s happening in their communities—and why we must do better.

Share Your State

Help us raise awareness and build momentum for smarter climate investments by sharing your state’s graphic:

  • Download your state’s graphic and copy the caption provided
  • Tag your local elected officials to demand stronger climate action
  • Use hashtags like #50WeeksOfAtlas, #AtlasOfAccountability, and #DisasterPreparedness
  • Start a conversation in your community using data that speaks to your neighbors
  • Encourage others to download and post their state’s data

DOWNLOAD YOUR STATE AND SHARE ON SOCIAL MEDIA

Between 2011-2023, #AL faced 19 federally declared disasters from severe storms, and five hurricanes. This shows the urgent need for increased funding to protect our most vulnerable communities. #AtlasOfAccountability #50WeeksofAtlas #DisasterPreparedness
Download Graphic
From 2011-2023, Alaska experienced 21 major disasters –11 due to flooding. The Bethel Census Area experienced the most, w/ 7 federally declared disasters. Time to prioritize proactive investments in resilient infrastructure. Read our #AtlasOfAccountability: bit.ly/rebuildaoa
Download Graphic
Between 2011-2023, Arizona faced 7 federally declared flood disasters, yet, extreme heat waves—deadly but with low physical damages—went unrecognized. Communities nationwide need resilient infrastructure & long-term climate adaptation to tackle growing climate risks. Read our #AtlasOfAccountability: bit.ly/rebuildaoa
Download Graphic
From 2011-2024, CA counties & tribal areas faced 36 major disasters, including wildfires and flooding, costing taxpayers $8.9B – that's $224 per capita. It's time for action. Explore #AtlasofAccountability: bit.ly/rebuildaoa
Download Graphic
Counties nationwide face devastation from extreme weather and disasters. El Paso County alone experienced 5 disasters and $45M in costs from 2011-2024. It's time to take action—share data, invest wisely, and help communities prepare. Explore the Atlas: bit.ly/rebuildaoa
Download Graphic
Each missed investment damages livelihoods. From 2011-2024, CT faced 11 major disasters from extreme weather, showing the need for better infrastructure & long-term recovery efforts. Explore #AtlasofAccountability bit.ly/rebuildaoa
Download Graphic
From 2011-2024, every county faced federally declared disasters. New Castle County saw the most. We must invest in resilient infrastructure to protect lives & reduce future devastation. Explore #AtlasofAccountability: bit.ly/rebuildaoa
Download Graphic
From 2011-2024, FL faced 21 major disasters, costing taxpayers $12B+. With 99.5% of congressional districts impacted, investing in resilient infrastructure is critical. Explore the #AtlasofAccountability: bit.ly/rebuildaoa
Download Graphic
Since 2011, every GA county has faced disasters—Fulton had nine. Every one dollar for resilience saves $13 in recovery, protecting lives & jobs. We cannot wait any longer. Explore the #AtlasofAccountability: bit.ly/rebuildaoa
Download Graphic
Since 2011, Hawai’i has faced 13 federally declared disasters, costing taxpayers $2.5B. The threat is growing. States must prepare—bonds, surcharges & superfunds can help protect communities & cut costs. Discover #AtlasofAccountability: bit.ly/rebuildaoa
Download Graphic
Since 2011, federally declared disasters cost taxpayers $70M+—7 of 10 from flooding. Preparedness is key. Let’s invest in reforms for lower costs, stronger infrastructure & thriving communities. Explore #AtlasofAccountability: bit.ly/rebuildaoa
Download Graphic
50 Weeks of Atlas: Illinois Spotlight Since 2011, Illinois has faced 9 federally declared disasters, costing over $ 858 M. In 2024, a severe storm caused 200K outages and claimed lives. We can't wait—investing in resilient infrastructure is essential. Explore #AtlasofAccountability: bit.ly/rebuildaoa
Download Graphic
50 Weeks of Atlas: Indiana Spotlight Since 2011, Indiana has had 5 federally declared disasters, costing $65M. 95% of Americans live in disaster-hit counties. We need resilient infrastructure for communities to prepare for future risks. Explore #AtlasofAccountability: bit.ly/rebuildaoa
Download Graphic
50 Weeks of Atlas: Iowa Spotlight Since 2011, Iowa has faced numerous federal disasters—19 from flooding—costing taxpayers $1B+. Over half its counties saw 5+ events. With 80% of states hit by 10+ storms, inaction risks lives and the economy. Explore #AtlasofAccountability: bit.ly/rebuildaoa
Download Graphic
50 Weeks of Atlas: Kansas Since 2011, 104 of 105 Kansas counties faced federal disasters, costing over $225M. Barton and Pawnee Counties lead with 11 each. Investing in resilient infrastructure is key to protecting communities. Explore #AtlasofAccountability: bit.ly/rebuildaoa
Download Graphic
50 Weeks of Atlas: Kentucky Spotlight Since 2011, KY has faced 23 federal disasters. Flooding in Feb 2025 claimed 23 lives and left 14K without power. With 26 counties hit 10+ times, it’s clear: people and businesses must be better prepared. Investing in resilience protects our future. Explore #AtlasofAccountability: bit.ly/rebuildaoa
Download Graphic
50 Weeks of Atlas: Louisiana Spotlight Every county in Louisiana has faced a federally declared disaster, totaling over $13B. Louisiana leads in per capita disaster funding at $2,953. Investing in resilient infrastructure is key for recovery. Explore #AtlasofAccountability: bit.ly/rebuildaoa
Download Graphic
50 Weeks of Atlas: Maine Spotlight From 2011–2024, every Maine county faced a federal disaster. April’s snowstorm caused $3.5M in damages. We all play a role in strengthening infrastructure and reducing recovery costs. Explore #AtlasofAccountability: bit.ly/rebuildaoa
Download Graphic
50 Weeks of Atlas: Maryland Spotlight From Irene to Isaias, MD faced 10 disasters since 2011—costing $250M+. It’s time for state-level funding for resilient infrastructure to help prepare communities before the next storm. Explore #AtlasofAccountability: bit.ly/rebuildaoa
Download Graphic
50 Weeks of Atlas: Massachusetts Spotlight Massachusetts faced 11 disasters from 2011–2024, costing over $540M. Extreme weather events like hurricanes, storms, and snowstorms are on the rise. It’s time for state-level funding to build resilient infrastructure. Explore #AtlasofAccountability: bit.ly/rebuildaoa
Download Graphic
50 Weeks of Atlas: Michigan Spotlight Michigan faced 7 disasters from 2011–2024—3 in Wayne County alone, costing $54M. Investing in storm-ready infrastructure saves billions, protects jobs, and builds resilience. Let’s act now. Explore the #AtlasofAccountability:bit.ly/rebuildaoa
Download Graphic
50 Weeks of Atlas: Minnesota Spotlight Since 2011, Minnesota has faced 16 federally declared disasters, costing taxpayers over $348M. Every county has been hit. It’s time to invest in resilient infrastructure—before the next storm: bit.ly/rebuildaoa
Download Graphic
50 Weeks of Atlas: Mississippi Spotlight Since 2011, Mississippi has faced 25 federal disasters—Hinds and Yazoo Counties lead with 12. Storms, floods, and tornadoes strain budgets and lives. It’s time to invest in resilient infrastructure. Explore #AtlasofAccountability: bit.ly/rebuildaoa
Download Graphic
50 Weeks of Atlas: Missouri Spotlight Missouri has faced 17 federally declared disasters since 2011, costing taxpayers over $1.1 billion. It’s time to act. Investing in storm-ready infrastructure now could help reduce future costs and better prepare our communities. Explore #AtlasofAccountability: bit.ly/rebuildaoa
Download Graphic
50 Weeks of Atlas: Montana Spotlight Montana has faced 18 federally declared disasters since 2011, with Blaine County experiencing 6 of them. Across the state, 11 flooding events have occurred. It’s time for proactive measures—investing in storm-ready infrastructure can save millions. Explore #AtlasofAccountability: bit.ly/rebuildaoa
Download Graphic
50 Weeks of Atlas: Nebraska Spotlight Every #Nebraska county has faced a disaster since 2011; Douglas County had 13. With recent deadly floods, preparedness is urgent. Storm-ready infrastructure could help protect jobs and prepare communities. Explore #AtlasofAccountability: bit.ly/rebuildaoa
Download Graphic
50 Weeks of Atlas: Nevada Spotlight Since 2011, Nevada has had 4 federally declared disasters, impacting more than half of the state. Proactive investments can help protect communities and reduce long-term costs. Explore #AtlasofAccountability: bit.ly/rebuildaoa
Download Graphic
50 Weeks of Atlas: New Hampshire Spotlight Since 2011, NH has faced 22 federally declared disasters, costing over $106M. Without action, those costs—and the risks to local economies—keep rising. Explore #AtlasofAccountability: bit.ly/rebuildaoa
Download Graphic
50 Weeks of Atlas: New Jersey Spotlight Since 2011, NJ has faced 14 federally declared disasters costing $7.9B. Storms like Irene, Sandy & Ida—and recent flooding that claimed 2 lives—show the need for storm-ready infrastructure to cut costs & help protect communities. #AtlasofAccountability: bit.ly/rebuildaoa
Download Graphic
50 Weeks of Atlas: New Mexico Spotlight Since 2011, New Mexico has faced 14 federally declared disasters costing $543M, from storms to floods to wildfires. The cost of inaction is rising—storm-ready infrastructure can help protect communities. Explore #AtlasofAccountability: bit.ly/rebuildaoa
Download Graphic
50 Weeks of Atlas: New York Spotlight Since 2011, NY has faced 23 federally declared disasters costing $27.8B. Initiatives like the Environmental Bond Act mark efforts to address future risks. Explore #AtlasofAccountability: bit.ly/rebuildaoa
Download Graphic
50 Weeks of Atlas: North Carolina Spotlight Since 2011, NC has faced 17 federally declared disasters costing $4.4B. Proactive adaptation measures can help protect families, jobs & tax dollars. Explore #AtlasofAccountability: bit.ly/rebuildaoa
Download Graphic
50 Weeks of Atlas: North Dakota Spotlight Since 2011, ND has faced 18 federally declared disasters costing $659M. Extreme weather is rising—the time to act is now to help prepare communities. Explore #AtlasofAccountability: bit.ly/rebuildaoa
Download Graphic
50 Weeks of Atlas: Ohio Spotlight Since 2011, OH has faced 7 federally declared disasters costing $226M. Resilience investments today can help protect families & reduce future costs. Explore #AtlasofAccountability: bit.ly/rebuildaoa
Download Graphic
50 Weeks of Atlas: Oklahoma Spotlight Since 2011, OK has faced 30 federally declared disasters costing over $1B. Investing in resilience—hazard mitigation & stronger infrastructure—can help reduce losses & protect families. Explore #AtlasofAccountability: bit.ly/rebuildaoa
Download Graphic
50 Weeks of Atlas: Oregon Spotlight 14 disasters from 2011-2024. Over $1.2B in costs. Storms, floods, and wildfires. Extreme weather is hitting harder. Preparedness & mitigation can help protect lives & save dollars. Explore #AtlasofAccountability: bit.ly/rebuildaoa
Download Graphic
50 Weeks of Atlas: Pennsylvania Spotlight Since 2011, PA has faced 10 disasters costing taxpayers $758M. We cannot wait any longer. Every disaster strains budgets, shutters businesses, and puts families at risk. Explore #AtlasofAccountability: bit.ly/rebuildaoa
Download Graphic
50 Weeks of Atlas: Rhode Island Spotlight Since 2011, RI has faced 8 federally declared disasters costing $66M. Resilience measures could help reduce future losses & help protect communities. Explore #AtlasofAccountability: bit.ly/rebuildaoa
Download Graphic
50 Weeks of Atlas: South Carolina Spotlight Since 2011, SC has faced 11 federally declared disasters costing $1.7B. Proactive investments could help reduce future losses & help protect families. Explore #AtlasofAccountability: bit.ly/rebuildaoa
Download Graphic
50 Weeks of Atlas: South Dakota Spotlight Since 2011, SD has faced 22 federally declared disasters costing $301M. State-led resilience efforts may help reduce future losses & help protect families. Explore #AtlasofAccountability: bit.ly/rebuildaoa
Download Graphic

LOOKING FOR YOUR STATE?

New states drop every week in alphabetical order. Follow us on social media to see when yours is released!
Follow Us

THE ATLAS SERIES & RESOURCES

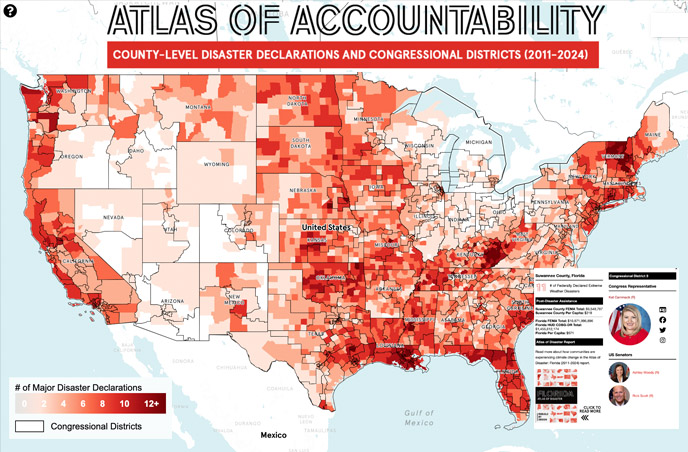
ATLAS OF ACCOUNTABILITY TOOL

The Atlas of Accountability maps federal disaster declarations and post-disaster assistance obligations for every county in the U.S., with overlays by congressional district between 2011-2024. Explore the map >>
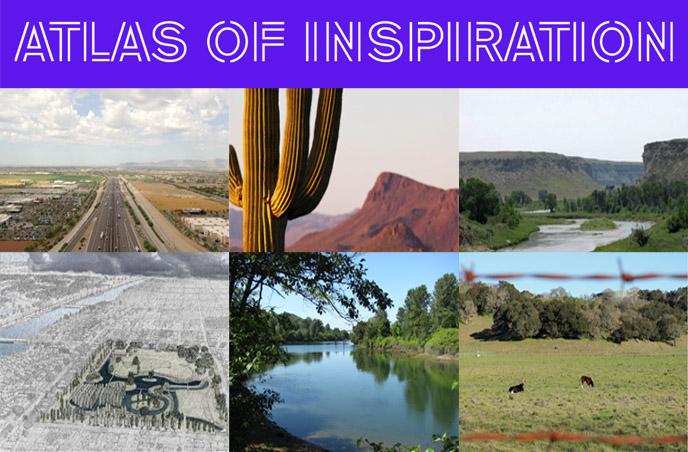
ATLAS OF DISASTER REPORT

Released in 2022, the Atlas of Disaster offers a county-by-county snapshot of climate-driven disasters across the U.S. from 2011–2021. The report highlights widespread impacts, gaps in federal policy, and the urgent need for pre-disaster investment in both physical and social infrastructure. Read the report >> 

ATLAS ON THE ROAD

Rebuild by Design expanded its national efforts through convenings, speaker series, and partnerships to support climate education and state-level reform. From New Jersey to Vermont, Kentucky, and Massachusetts, we are working with communities to move policy and funding forward. Learn more >>

Translate